Canada Markets
Year-Over-Year Change in Wheat Exports
Ahead of Statistics Canada's official export data release for the month of November, the Canadian Grain Commission's Exports of Canadian Grain and Wheat Flour report for November includes exports from licensed facilities which will capture the bulk of exports.
The report shows cumulative exports of wheat (excluding durum) for the August-through-November period at 7.2426 million metric tons (mmt), up 737,300 metric tons (mt) or 11.3% over the same four-month period in 2022-23. The report includes a list of 49 countries that have been shipped product during the four-month period from August through November, equal to the number shown for the same period in 2022-23.
It is interesting to note that Agriculture and Agri-Food Canada has revised its forecast for 2023-24 wheat exports 2 mmt higher this month to 20 mmt, while the current pace of movement still remains ahead of the pace needed to reach this forecast. The 20 mmt would be 612,000 mt or 3% lower than the volume exported in 2022-23, while as of November, we see exports up 11.3% from the same period in 2022-23.
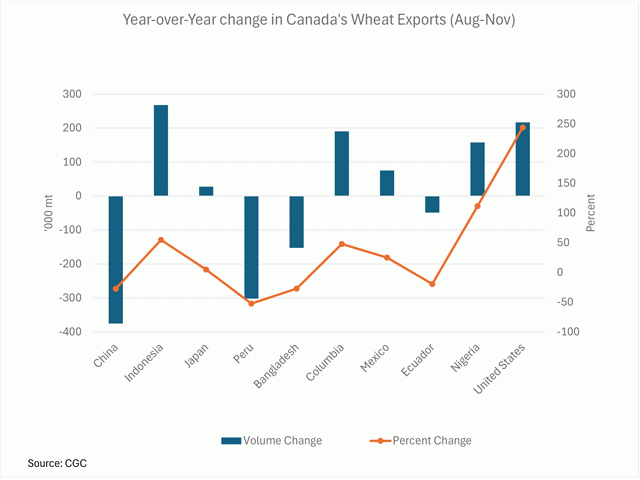
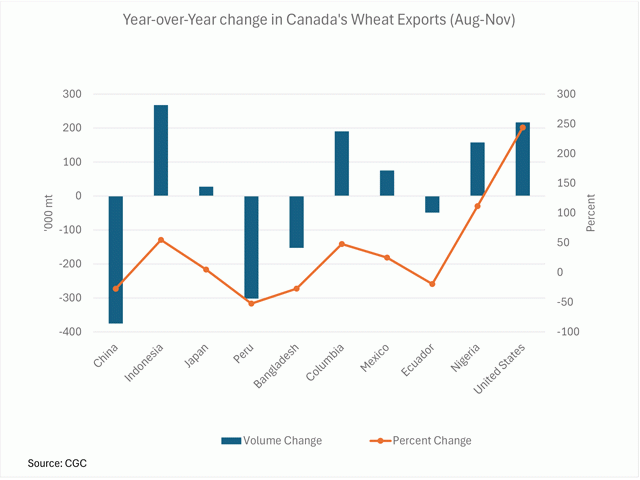
The attached chart shows cumulative export activity with Canada's 10 largest wheat destinations from 2022-23. Of these 10 countries, exports have increased year-over-year to six over the first four months of 2023-24. Exports to China have fallen 375,300 mt or 27.4% from the same period in the previous crop year to 993,000 mt, while China was the top export destination in 2022-23 with almost 3 mmt shipped in total.
P[L1] D[0x0] M[300x250] OOP[F] ADUNIT[] T[]
It is interesting to note when the year-over-year change in volume across these 10 destinations is totaled, the total volume is up only 55,300 mt from the same period in 2022-23, suggesting that Canadian exporters are making new inroads elsewhere.
From the list of 49 countries, we see that there are five countries showing a volume shipped from August through November of 2024 where there was no volume shipped in the same period in 2022-23, totaling 189,200 mt. There is also five countries where volumes were reported in 2022-23, while the balance to-date is zero for the current crop year, totaling 53,200 mt.
Of the 49 countries listed, there is a year-over-year increase in volume reported for 31 countries, with the largest year-over-year increase reported in volumes shipped to Indonesia. The largest year-over-year drop in volumes is seen for China, with exports down 375,300 mt.
As seen on the attached chart, volumes shipped to the United States over the first four months total 305,700 mt, up 216,800 mt or 244% from the previous year, the largest year-over-year percent increase in volume of the 10 destinations shown.
Cliff Jamieson can be reached at cliff.jamieson@dtn.com
Follow him on X, formerly known as Twitter, @CliffJamieson
Cliff Jamieson can be reached at cliff.jamieson@dtn.com.
Follow him on X, formerly known as Twitter, @CliffJamieson.
(c) Copyright 2023 DTN, LLC. All rights reserved.


Comments
To comment, please Log In or Join our Community .