

Canada Markets
Statistics Canada Reports Aug. 31 Row Crop Stocks

Statistics Canada released updated reports today to finalize 2022-23 data for row crops, including the Stocks of grain and oilseed report, as well as the Supply and disposition of grains in Canada report.
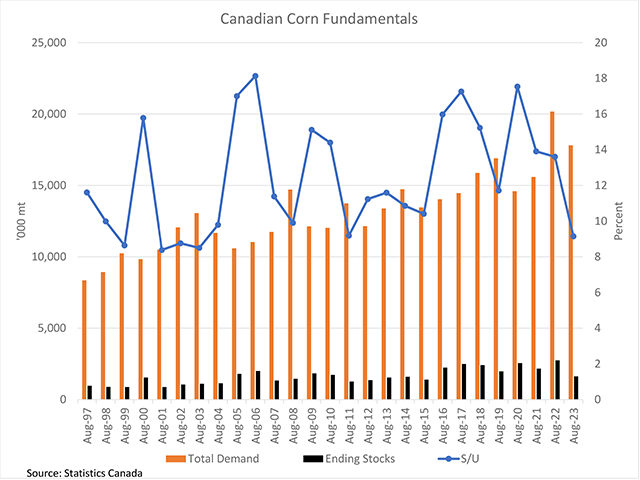
Statistics Canada estimates corn stocks as of Aug. 31 at 1.6275 million metric tons (mmt), down 1.118 mmt or 41.2% from Aug. 31, 2022. This is the largest year-over-year drop in Statistics Canada data going back to 1996, likely a record drop, while the lowest stocks seen in eight years or since 2014-15. This was very close to the 1.650 mmt estimated by Agriculture and Agri-Food Canada (AAFC), an estimate that was revised lower in each of the past four months from the 2.5 mmt estimate released in May.
The trend in stocks is seen by the black bars on the attached chart, with 2022-23 carryout stocks down from the previous year's record high of 2.746 mmt while 31% below the five-year average stocks. Commercial stocks of 732,800 mt are the lowest seen in two years while estimated farm stocks of 894,700 mt, the most challenging to estimate, are the lowest reported since Aug. 31, 2012, or 11 years.
P[L1] D[0x0] M[300x250] OOP[F] ADUNIT[] T[]
Standing out in the updated data tables is record corn exports of 2.646 mmt, up from the five-year average of 1.545 mmt. As seen with the blue line on the attached chart, the stocks/use ratio has fallen for a third year to 9.1%, the lowest percentage calculated since the 2002-03 crop year.
Despite the tighter ending stocks reported, 2023-24 supplies are forecast close to the levels estimated for 2022-23 by AAFC, with increased imports accounting for the difference, currently forecast at 3 mmt.
Today's report estimates soybean stocks at 376,200 mt, up from 287,100 mt reported one year ago and below the five-year average of 511,000 mt. While this is the highest stocks reported in three years, it continues to reflect a tight supply situation with the stocks/use ratio calculated at 5.4%.
The increase in stocks combined with a higher estimated production for 2023 has contributed to a forecast for slightly higher supplies available in 2023-24 than estimated for the previous crop year.
Cliff Jamieson can be reached at cliff.jamieson@dtn.com
Follow him on X, formerly known as Twitter, @Cliff Jamieson
(c) Copyright 2023 DTN, LLC. All rights reserved.
Comments
To comment, please Log In or Join our Community .