

Canada Markets
Statistics Canada to Release back-to-back Production Estimates
The guessing games have begun ahead of Statistics Canada's first production estimates of the year, to be released on Aug. 29. It should be reminded that this report, based on July model data, will be followed by a second release of model-based results on Sept. 14, based on August model data.
It is likely that the full extent of crop losses will not be evident until the September report is released. When the government crop condition ratings are considered, we see only modest deterioration when it comes to spring wheat condition in Manitoba, with the majority of the crop rated fair to poor in both the mid-July report and the mid-August government Crop Report. The same can be said for Alberta, with the good-to-excellent crop rating falling from 1.5 points to 4.3 points for wheat, durum, canola, peas and barley from the July 11 report to the Aug. 8 report.
It is the Saskatchewan crop that shows the majority of the condition deterioration. From the July 10 to the July 24 report, the good-to-excellent rating fell 15 points for spring wheat, 10 points for durum, 13 points for canola, 18 points for peas and 21 points for barley. With conditions changing rapidly, it is unlikely the July model was able to capture this change.
P[L1] D[0x0] M[300x250] OOP[F] ADUNIT[] T[]
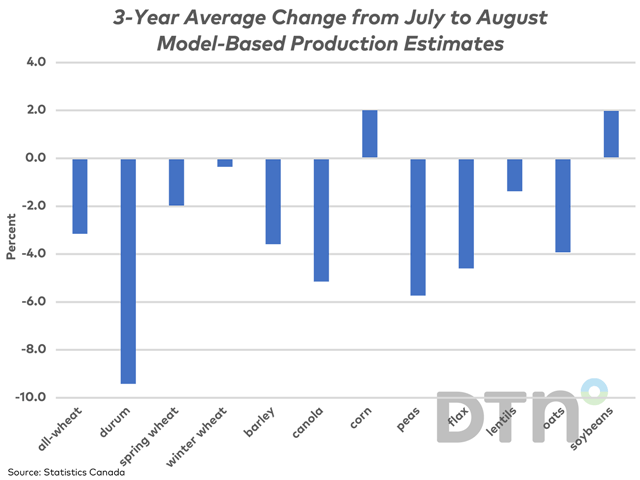
The attached chart shows the three-year average percent change in production estimates from the July model-based estimates to the August model-based estimates for 2020 to 2022, the first years where the model-based approach was used for both reports.
The smallest average change is seen for winter wheat, where the August data (released in September) produced an average production estimate 0.4% lower than the July model. The largest average change is seen for durum, with a 9.4% drop.
It is interesting to note that eastern row crops tend to grow larger on paper in the August estimates, with both corn and soybean crops averaging a 2% increase in size from the July report to the August report. Both crops also showed consistency and were revised higher in each of the three years.
Western crops, on the other hand, tend to be revised lower from one forecast to the next. Of the select crops shown, durum, canola, dry pea and flax estimates showed consistency and were revised lower in each of the past three years.
One could look at the 2021 drought year as having the largest downward revisions overall from the July to the August reports, but this is not entirely the case. Durum production was revised 11.4% lower from the July estimate to the August estimate in 2020 and 11.3% lower in 2021. A similar finding is seen for dry peas, where the crop size was revised 12.7% lower in 2020 and only 3.8% lower in 2021.
Cliff Jamieson can be reached at cliff.jamieson@dtn.com
Follow him on X, formerly known as Twitter, @Cliff Jamieson
(c) Copyright 2023 DTN, LLC. All rights reserved.

Comments
To comment, please Log In or Join our Community .