Canada Markets
The Canadian Dollar Rally Shows Signs of Ending
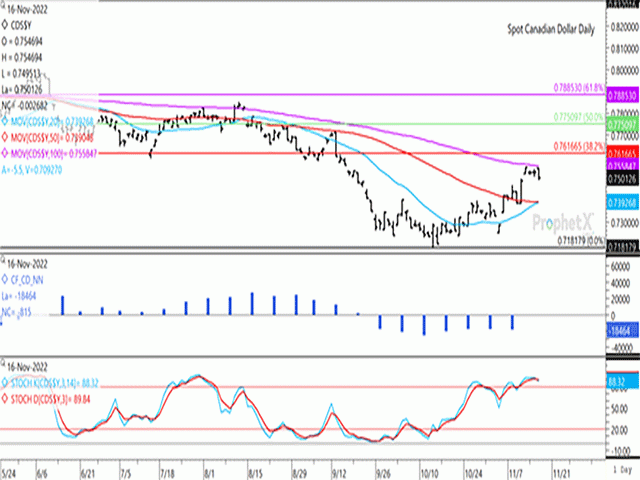
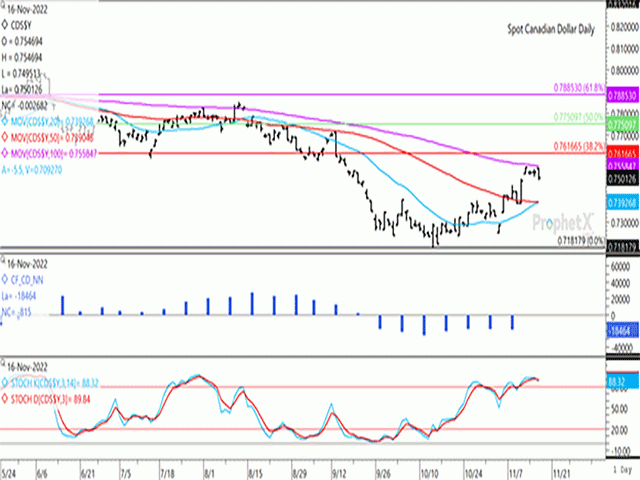
The Canadian dollar has moved from a low of $0.718179 CAD/USD on Oct. 13 to a high of $0.754928 CAD/USD on Nov. 11, or roughly 367 basis points, while the move shows signs of stalling.
The Nov. 16 high fell just short of testing the Nov. 11 high, while also fell just short of testing the 100-day moving average of the exchange rate which is calculated at $0.755841 CAD/USD. This moving average is significant; since reaching the June 1, 2021 high, the spot dollar exchange rate has moved above the 100-day moving average five times but each move was brief, and has led to lower-highs in four of the five moves above the 100-day.
The Nov. 16 move resulted in a bearish outside bar formed on the daily chart, trading higher then lower than the previous two sessions, while ending lower. The move also filled the gap in trade formed from the move from Nov. 10 to Nov. 11, although today's close found support above $0.75 CAD/USD as well as above the lower end of the recent gap in trade.
Equityclock.com shows the Canadian dollar reaching a seasonal high for the year in the month of October while the loonie tends to weaken in November. Over the past 20 years, the Canadian dollar future has averaged a 0.6% loss, which is the last of three monthly losses shown for the year and the largest monthly average loss seen during the year. During the past 20 years, the loonie has gained strength in 35% of the years in question, ranging from a maximum gain of 2.7% to a maximum loss of 5.7%. The spot dollar chart shows that the Canadian dollar's exchange with the U.S. dollar has weakened in four of the past five Novembers (2017-21), with the loss averaging 37.6 basis points.
P[L1] D[0x0] M[300x250] OOP[F] ADUNIT[] T[]
The first study on the attached chart shows the histogram of the noncommercial or speculative net-short position, which has grown larger for the first time in four weeks in the week ending Nov. 8 to 18,464 contracts net-short. This data shows the most recent data is close to testing the longest stretch of bearish noncommercial activity seen since January.
The stochastic momentum indicators seen in the lower study signals recent attempts to sustain upward momentum, although today's trade resulted in a bearish cross-over of indicators while in overbought territory and may be signaling a bearish turn.
Should this exchange sustain a move below $0.75 CAD/USD, watch for a potential drop to the 38.2% retracement of the move from the October low to November high at $0.7409 CAD/USD, while psychological support lies at $0.74 CAD/USD and the intersection of the 20-day and 50-day moving averages, close to $0.7390 CAD/USD.
Today's Statistics Canada Consumer Price Index shows the CPI unchanged in October at 6.9%, which may lead to increased uncertainty surrounding the Bank of Canada's next move, with its next policy interest rate announcement on Dec. 7.
**
DTN Virtual Ag Summit
This year's DTN Ag Summit will be held virtually on the mornings of Dec. 12-13, so you can join from the comfort of your own home. Further details can be found at http://www.dtn.com/….
Cliff Jamieson can be reached at cliff.jamieson@dtn.com
Follow him on Twitter @Cliff Jamieson
(c) Copyright 2022 DTN, LLC. All rights reserved.


Comments
To comment, please Log In or Join our Community .