

Canada Markets
Statistics Canada Production Estimates, September to December Change
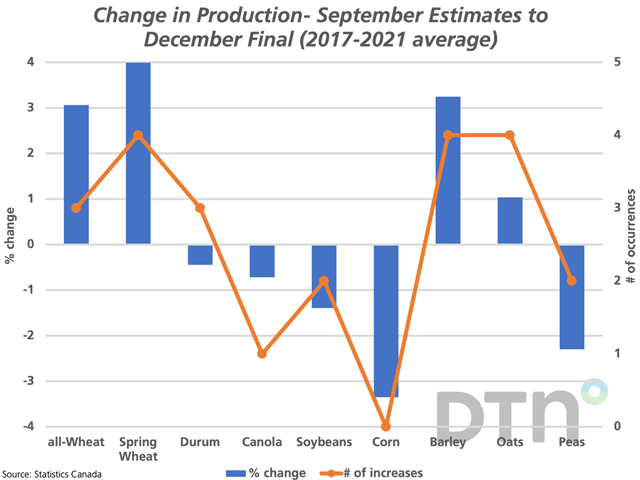
The blue bars on the attached chart shows the five-year average percent change in Statistics Canada's crop production estimates from the model-based September estimates, based on August model data, to the final November estimates, based on producer surveys conducted in November and released in the first week of December. These bars are measured against the primary vertical axis.
Of the crops selected, the average change from September to December estimates for all-wheat, spring wheat, barley and oats points to an increase in production estimates, with spring wheat increasing by an average of 4%, all-wheat increasing by 3.1%, barley increasing by 3.2% and oats by 1%. In other words, the model-based analysis tends to understate the production for these crops based on August data.
P[L1] D[0x0] M[300x250] OOP[F] ADUNIT[] T[]
The average change in production tends to decrease from the September report to the December report for corn (-3.4%), peas (-2.3%), soybeans (-1.4%) and durum (-0.4). The August model tends to overstate the potential for these crops based on the data released in December, which ignore any revisions made to forecasts following the final estimate of the year.
The brown line with markers shows the frequency of higher revisions in production from one report to the next over the past five years, plotted against the secondary vertical axis. This ranges from zero for corn to four times for spring wheat, barley and oats.
Statistics Canada will release the November estimates on Dec. 2.
Cliff Jamieson can be reached at cliff.jamieson@dtn.com
Follow him on Twitter @Cliff Jamieson
(c) Copyright 2022 DTN, LLC. All rights reserved.

Comments
To comment, please Log In or Join our Community .