Canada Markets
Saskatchewan Agriculture's Topsoil Moisture Analysis
Saskatchewan Agriculture's final Crop Report of the year highlights the varying precipitation received across the province, as we have highlighted throughout the growing season, along with the wide range of yields that were a result. This week's report as of Oct. 17 shows most crops in the Southwest Region yielding 50% of the 10-year average, while West-Central crops were also below average. At the same time, yields were reported above average for the Northwest, the Northeast, the East-Central and Southeastern Region.
Another reminder in this year's final report is the timing of the rains, with late rains arriving in areas of the western regions that prevented a total disaster in some areas, while rains in the eastern regions ended in mid-August to allow harvest of an above-average quality crop.
P[L1] D[0x0] M[300x250] OOP[F] ADUNIT[] T[]
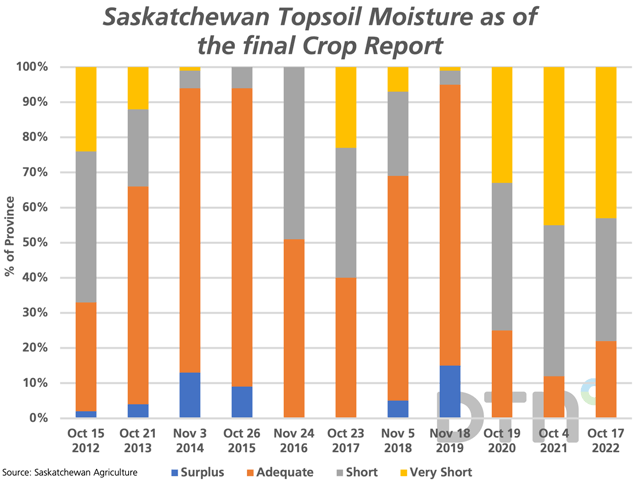
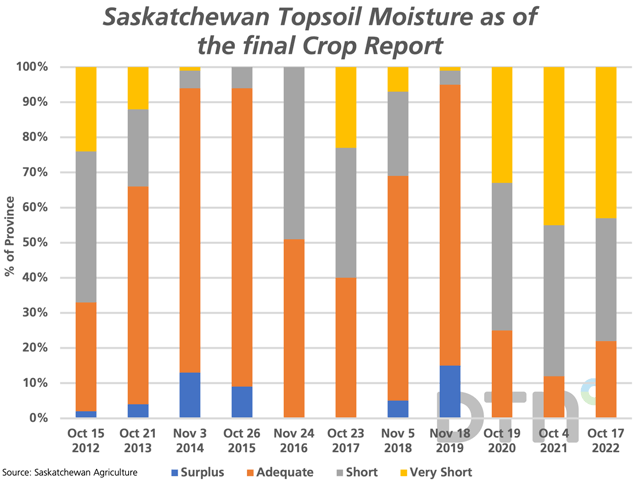
This report also highlights the growing concern about the dry conditions faced in the province as we near winter. As of Oct. 17, cropland topsoil moisture is rated at 22% Adequate, 35% Short and 43% Very Short (78% Short to Very Short), which shows deterioration for a third straight report released during the past four weeks.
As seen on the attached chart, the area rated Short to Very Short (grey and yellow shaded bars) of 78% is close to the 88% reported one year ago and the 75% reported two years ago.
On Oct. 19, the Saskatchewan Stock Growers Association tweeted "Present drought in southwest SK is significantly drier than the droughts of the '30s and '80s." Their attached chart is the Swift Current Annual Precipitation Departure from Average, which shows a negative departure for 11 consecutive years, while the 2022 departure is shown at roughly minus 300 millimeters (11.8 inches), significantly higher than any other year going back to 1911.
Cliff Jamieson can be reached at cliff.jamieson@dtn.com
Follow him on Twitter @Cliff Jamieson
(c) Copyright 2022 DTN, LLC. All rights reserved.


Comments
To comment, please Log In or Join our Community .