Canada Markets
Licensed Deliveries as of Week 6, What's Moving?
The Canadian Grain Commisssion's Grain Statistics Weekly for week 6, or the week ending Sept. 11, shows 1.9433 million metric tons (mmt) of all grain delivered during the past week, climbing for a fifth consecutive week as the prairie harvest advances. During the first six weeks, 6.3588 mmt of all grain has been unloaded in the licensed handling system, up 1.8% from the same period in 2021-22, 2.9% below the three-year average and 1.1% below the five-year average.
Wheat stands out in week 6 data, with 1.051 mmt of wheat deliveries (excluding durum) seen during the past week, accounting for 54% of all deliveries. An additional 139,600 metric tons of durum were delivered, along with 336,200 mt of canola.
P[L1] D[0x0] M[300x250] OOP[F] ADUNIT[] T[]
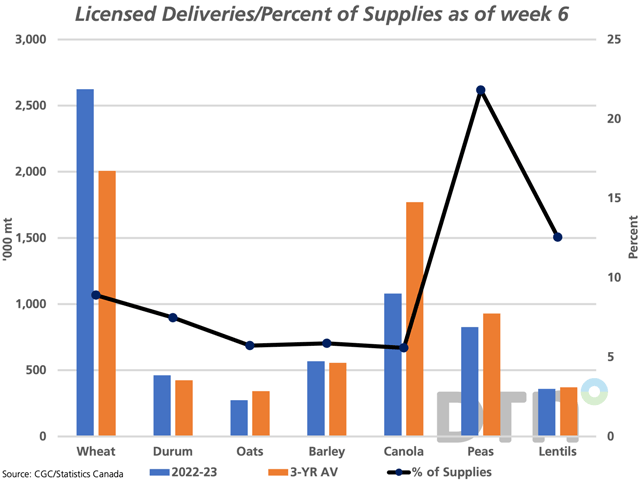
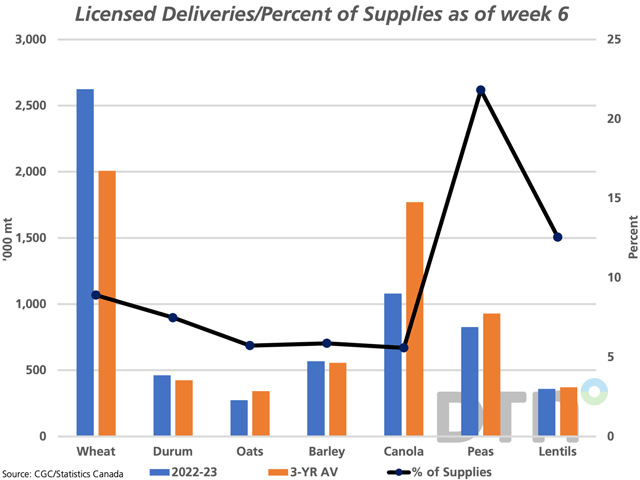
As seen on the attached chart, cumulative deliveries of wheat are reported at 2.624 mmt, up 27.4% from last year and up 30.8% from the three-year average. The country's wheat crop (excluding durum) is to be the third largest on record, while the black line with markers indicates that 8.9% of available supplies have been delivered, which compares to the three-year average of 7.5% for this week. The available supplies are calculated by the sum of Statistics Canada's July 31 farm stocks added to the agency's most recent production estimate.
While the canola harvest is behind average across the Prairies, we see cumulative deliveries of 1.0792 mmt down 28.8% from a year ago and 39% below the three-year average for this period. This volume represents 5.6% of total estimated supplies delivered in the first six weeks, which compares to the three-year average of 9.1% over this period. This bears watching, as it is affected by the slower pace of harvest but could also be a signal of producer willingness to sell, given the $338/mt slide in price from the November contract's April high to the current November future at $790/mt at the time of writing.
Another crop that stands out on the attached chart is dry peas. Cumulative deliveries are 825,700 mt, which is up 3.5% from the same period last year while down 11% from the three-year average. As a percentage of estimated supplies, cumulative deliveries total 21.8% of the total supplies available, or the estimated July 31 stocks added to the estimated production. While a rapid pace of deliveries, this is still lower than the 25% three-year average.
Despite the increase seen in deliveries in week 6, primary elevator stocks on the Prairies of 3.9837 mmt represents 73% of the estimated prairie working capacity; elevator space remains good overall.
Cliff Jamieson can be reached at cliff.jamieson@dtn.com
Follow him on Twitter @Cliff Jamieson
(c) Copyright 2022 DTN, LLC. All rights reserved.


Comments
To comment, please Log In or Join our Community .