Canada Markets
Statistics Canada Tweaks Production Estimates
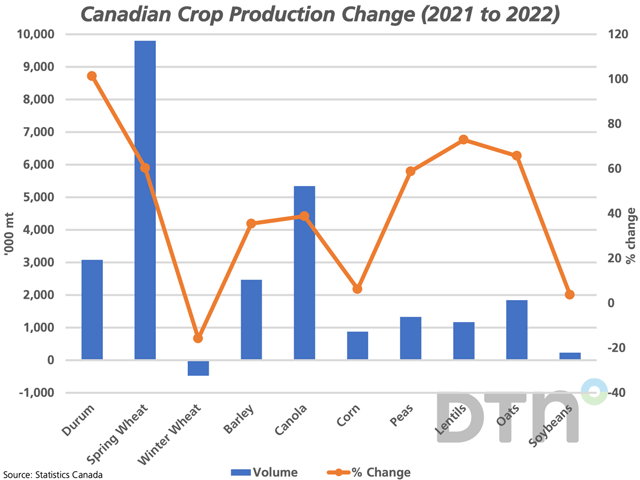
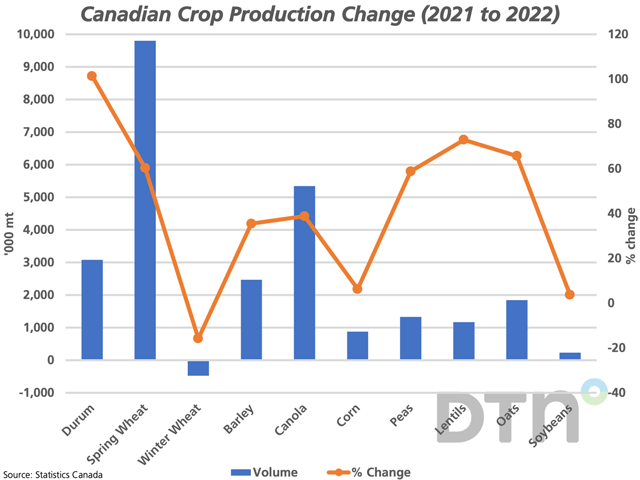
Sept. 14 saw a second release of Statistics Canada's model-based production estimates, this time based on model results generated during the month of August. Overall, the size of the Canadian crop was changed very little, with roughly as many upward adjustments made as there was lower ones since the July results were released on Aug. 29.
As has been discussed in recent weeks, higher-than-average temperatures and a lack of precipitation experienced in some western areas of the Prairies in August was expected to reduce the crop's potential, while Dow Jones commentary on ProphetX was discussing the potential for a downward revision for some crops in this report even prior to the release of the first report on Aug. 29.
Statistics Canada revised higher their forecast for Canada's all-wheat production by 131,000 metric tons to 34.703 million metric tons (mmt). This number remains in line with major estimates; a glance at the USDA's August World Agricultural Supply and Demand Estimates (WASDE) report shows a revision from 34 mmt to 35 mmt, so markets have been prepared for this size of crop for some time. This would be the third-largest Canadian wheat crop, while 13.3% higher than the five-year average.
Spring wheat production was revised 488,036 mt higher to 26.053 mmt. This volume is slightly lower than the size of the 2020 crop, while also the third-largest crop produced by the country. A yield comparison between today's Statistics Canada estimates and provincial estimates based on actual field inspections and producer contact shows slightly varying results. Today's report shows an average 59.4 bushel per acre (bpa) estimate for Manitoba, which compares to the province's latest crop report pointing to a 60-70 bpa average. Statistics Canada has estimated Saskatchewan yield at 47.8 bpa, above the province's 43 bpa estimate and the Alberta yield is estimated at 58.7 bpa, which compares to the province's 52.8 bpa estimate. Note that Alberta estimates dryland yield only; during the past five years, the final official estimate has averaged 11.5% higher than the provincial government estimate.
P[L1] D[0x0] M[300x250] OOP[F] ADUNIT[] T[]
While bearish for wheat overall, MGEX HRS for December delivery has reached its highest trade in more than six weeks in morning trade. The prairie harvest has a way to go to reach the end, with this week's Manitoba Crop Report estimating the spring wheat harvest at 57% complete, which compares to the four-year average of 83%.
Statistics Canada largely offset this gain in spring wheat production with a 355,531 mt lower revision in estimated durum production to 6.117 mmt. While a lower revision was expected, given the conditions faced across southern and western areas of the Prairies in August, the latest Saskatchewan government yield estimate continues to cast suspicion on today's estimate.
While Statistics Canada reduced its durum yield expectation by 2.8 bpa for Saskatchewan to 36 bpa, the Saskatchewan government estimated yield at 30 bpa as of Sept. 5. The difference between these two estimates is 777,433 mt, based on the estimated harvested acres for Saskatchewan which accounts for 77.3% of the national acres. This bears watching.
The canola estimate was revised 400,000 acres lower to 19.099 mmt, up 38.8% from the previous year, while 0.2% higher than the five-year average. There were some expectations that this estimate may have been trimmed even further. When compared to provincial data, Statistics Canada is estimating Manitoba yield at 42.5 bpa, which compares to early indications from the Manitoba government of a range from 45-55 bpa, although note that only 11% is estimated harvested. Today's estimate for Saskatchewan is 37.8 bpa compared to the province's recent estimate of 34 bpa and the official estimate for Alberta is 41.7 bpa, while the Alberta government's dryland yield estimate is 41 bpa.
Statistics Canada estimated lentil production 128,670 mt lower than the last estimate and dry pea production lower by a volume of 24,273 mt. Of the crops that saw modest upward revisions today, barley production was revised 81,800 mt higher and oat production was revised 183,000 mt higher.
Estimated corn production was revised slightly higher to 14.861 mmt, which would reflect a record crop for the country. It is interesting to note that Statistics Canada estimated the Ontario yield at 172.6 bpa, where close to two-thirds of the country's harvested acres are found. Earlier this week, the Great Lakes Grain crop tour of the province ended with an average yield of 176.9 bpa. The country's corn production could see further upward revisions.
Soybean production was revised 123,440 mt higher to 6.505 mmt, or the largest crop in four years. The official estimate for Ontario yield came in at 49.3 bpa as compared to the Great Lakes Grain tour average of 48.8 bpa. Statistics Canada is currently estimating 59% of the soybean harvested acres are located in the province of Ontario.
Cliff Jamieson can be reached at cliff.jamieson@dtn.com
Follow him on Twitter @Cliff Jamieson
(c) Copyright 2022 DTN, LLC. All rights reserved.


Comments
To comment, please Log In or Join our Community .