Canada Markets
Canola Liquidation Could Soon End
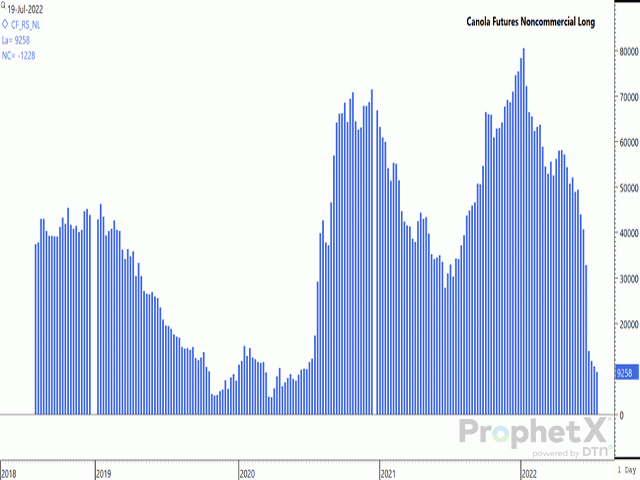
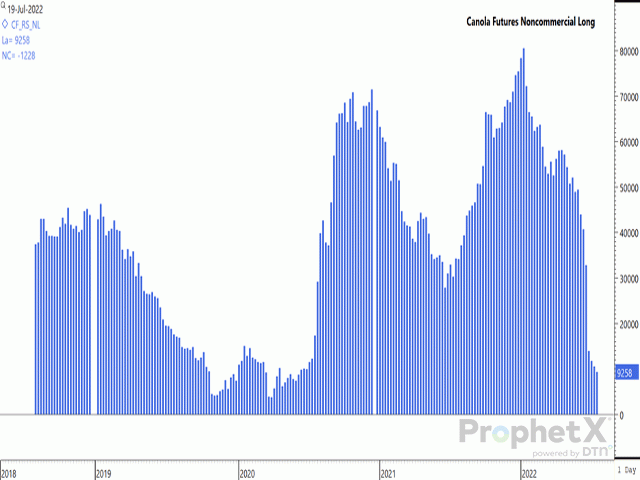
The histogram bars on the accompanying chart show the noncommercial long futures position, as reported weekly by the CFTC. This position reached an all-time high of 80,537 contracts in the week ended Jan. 11, while was reported at 9,258 contracts for the week ended July 19. This position has fallen in each of the past seven weeks, a period that also saw the overall futures position move from a net-long to a net-short position.
The noncommercial long position of 9,258 contracts has fallen to the lowest level seen since the week of June 9, 2020, or over two years. Since the CFTC began capturing canola data in August 2018, this position has never fallen below lows ranging from 3,730 contracts to 4,481 contracts, as seen shown for a period from Oct/Nov 2019 and March 2020.
The selling seen in 2022 should soon end. A glance at AAFC's most recent supply and demand tables shows crop year supplies estimated to rebound by 30.6% to 18.4 million metric tons (mmt), based on assumptions made surrounding 2021-22 carryout and production prospects for 2022 based on average yields. At the same time, the forecast for 2022-23 exports is 9 mmt, while up by a significant 75% from the previous crop year, would only be the ninth-highest canola export volume achieved by Canada. A smaller rebound in canola crush of 12% to 9.3 mmt would result in the third-highest crush achieved.
P[L1] D[0x0] M[300x250] OOP[F] ADUNIT[] T[]
This forecast is currently pointing to ending stocks of only 450,000 mt, which is up by a modest 50,000 mt from the previous crop year while remaining historically tight at 2.4% of 2022-23 demand.
This will not be overlooked on the commercial side, and watch for competition to heat up as we move closer to harvest. On July 26, the Vancouver track basis strengthened $5/metric ton (mt) to $90/mt over the November contract. As well, the ICE Canada Canola Board Margin Index, a proxy for the returns generated crushing canola, shows the nearby index increasing by $11.78/mt to $114.19/mt as of July 25. This is up from $41.47/mt reported for the same day one year ago, while note that this index is calculated above $100/mt through to the January 2023 period, providing huge incentive to crush in the months ahead.
Watch for the speculative side to return on the long side of the trade, with continued support above the floor created on the November chart in recent weeks. Any concerns surrounding crop size will quickly gain attention.
Cliff Jamieson can be reached at cliff.jamieson@dtn.com
Follow him on Twitter @Cliff Jamieson
(c) Copyright 2022 DTN, LLC. All rights reserved.


Comments
To comment, please Log In or Join our Community .