Canada Markets
November Canola Chart Bears Watching
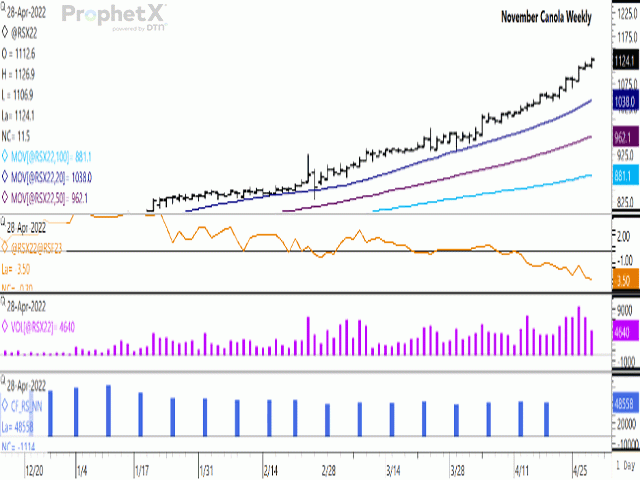
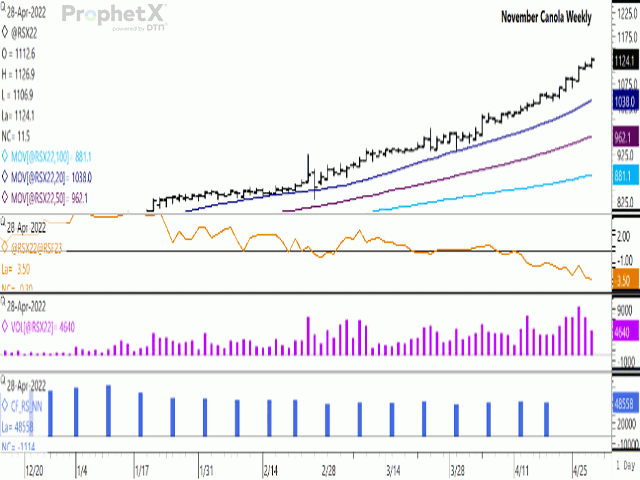
The trend is your friend and the November canola chart continues to reach fresh contract highs. This contract has reached a fresh high in 11 of the past 14 sessions. The last four contract highs reached also represent all-time highs on the continuous November chart (not shown). At the same time, this move will come to an end one day and according to some, may result in a very quick change in direction accompanied by a potential significant loss.
P[L1] D[0x0] M[300x250] OOP[F] ADUNIT[] T[]
The pink bars of the histogram in the second study show the daily volume for the November contract, with a contract high reached on April 26 at 9,408 contracts, while despite Statistics Canada's estimated 2022 seeded acres that represent a 7% drop to 20.9 million acres, trade volume has waned each day since. The April 28 November volume of 4,640 contracts was the lowest seen in six sessions.
What bears watching is the Nov/Jan spread, shown by the brown line seen in the first study. This spread closed at minus $3.50/mt on April 28 (January trading over the November), while the weekly chart (not shown) shows this spread weakening by $1.50/mt so far this week, a fourth consecutive week of weakness and so far, the largest weekly drop over these four weeks. This may point to an increasingly bearish view of market fundamentals, with the chance that Statistics Canada's acreage estimate went too far in trimming acres. This is the weakest spread seen for this contract in over one year, while only modestly stronger than the five-year average for this date at minus $3.80/mt.
Cliff Jamieson can be reached at cliff.jamieson@dtn.com
Follow him on Twitter @Cliff Jamieson
(c) Copyright 2022 DTN, LLC. All rights reserved.


Comments
To comment, please Log In or Join our Community .