Canada Markets
Licensed Grain Stocks as of Week 36, by Location
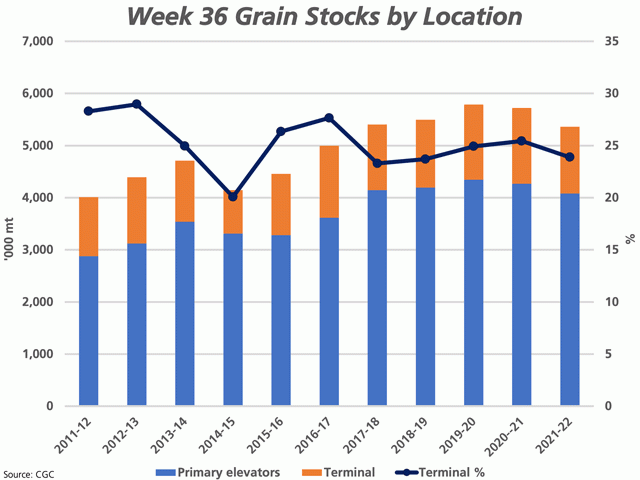
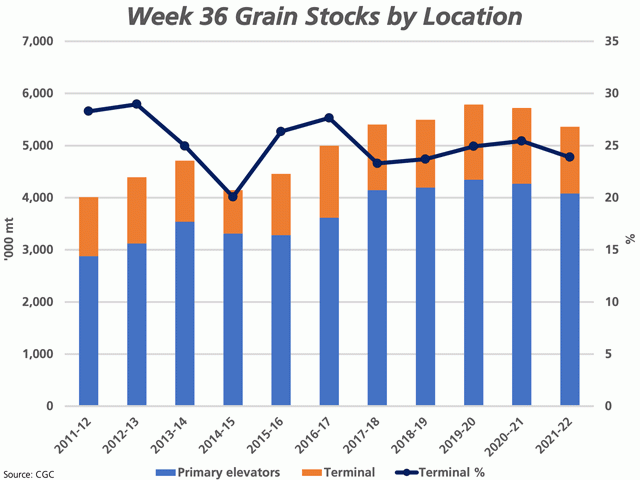
The weekly Grain Monitoring Program Weekly Performance Update reports primary elevator grain stocks at 4.0802 million metric tons, as reported by the Canadian Grain Commission, down only 4% from the same week in 2020-21 and also 4% below the three-year average for this week. This is despite the 30.2% year-over-year drop in production in all principal field crops in Canada, while this percentage drop would be even more severe when only prairie crops are considered.
As seen with the blue bars on the attached chart, primary elevator stocks are the lowest reported for this week in five years, while only 0.8% below the previous five-year average.
P[L1] D[0x0] M[300x250] OOP[F] ADUNIT[] T[]
The brown bars on the attached chart represents western export terminal stocks, reported at 1.2805 mmt, down 12% from last year and 8% below the three-year average. This includes the volumes instore the Port of Vancouver, Prince Rupert, Churchill and Thunder Bay. This is the lowest terminal stocks reported for week 36 in four years. The black line with markers represents terminal stocks as a percentage of total stocks, which is calculated at 23.9% as of week 36, the smallest percentage calculated in three years and compares to the five-year average of 25%.
One can only guess why primary stocks are so high relative to past years given the sharply lower production. Tight stocks will be rationed over the balance of the crop year as elevators meet demand in upcoming months, such as canola held for domestic crushers or wheat for shipment to Canadian or U.S. mills.
This crop year's railway struggles are also playing a role. The AG Transport Coalition's Weekly Performance Update Unfilled Shipper Demand chart shows cumulative unfilled demand of 6,289 hopper cars between CN and CP Rail as of week 36. This consists of 537 outstanding orders, 1,013 rejected cars, 2,556 railway cancellations and 2,183 cars classed as shortened supply. Of this total, 70% or 4,382 cars consists of orders for the West Coast terminals of Vancouver and Prince Rupert, while 1,126 cars or 18% were destined to Thunder Bay terminals.
While the grain may be slow to arrive, terminal loading is equally slow. The week 37 vessel list for Vancouver is reported to fall to four vessels, down from the one-year average of 16/week. The Prince Rupert lineup fell to zero vessels for week 37, down from the one-year average of one/week. Cliff Jamieson can be reached at cliff.jamieson@dtn.com
Follow him on Twitter @Cliff Jamieson
(c) Copyright 2022 DTN, LLC. All rights reserved.


Comments
To comment, please Log In or Join our Community .