
Canada Markets
2021-22 Canada Canola Demand Over 36 Weeks
Canada's canola exports were reported at 116,200 metric tons (mt) in week 36, or the week ending April 10, the largest volume shipped in three weeks and 160% higher than the four-week average. This volume was well above the 79,000 mt needed this week to stay on track to reach the current AAFC export forecast of 5.4 million metric tons (mmt) by July 31. Cumulative exports over 36 weeks total 4.1712 mmt, while 432,739 mt ahead of the steady pace needed to reach the current Agriculture and Agri-Food Canada (AAFC) forecast of 5.4 mmt.
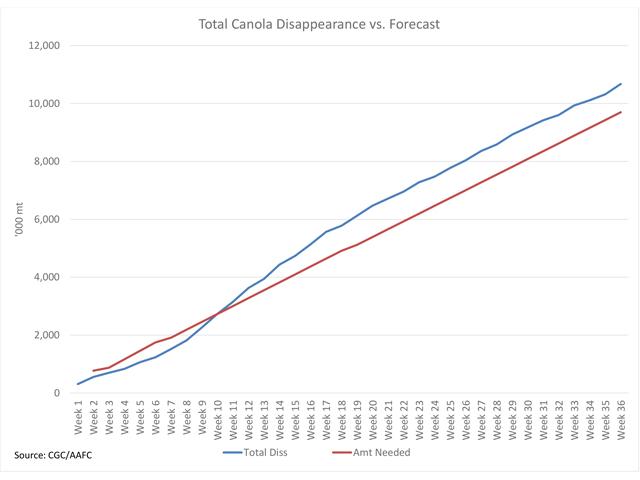
Domestic disappearance was reported at 229,100 mt, the largest volume reported in 25 weeks, or close to six months, while well above the 141,380 mt needed this week to stay on the steady pace needed to reach the current domestic disappearance forecast of 8.667 mmt. The domestic crush shows no sign of slowing. Cumulative disappearance over 36 weeks totals 6.505 mmt, while 505,069 mt ahead of the steady pace needed to reach the current demand forecast.
P[L1] D[0x0] M[300x250] OOP[F] ADUNIT[] T[]
Combined, total demand is 937,808 mt ahead of the steady pace needed to reach the current demand forecast.
As of week 36, producers have delivered 11.3613 mmt of canola into the licensed handling system, 28.3% below the same period last crop year and 20.3% below the three-year average. Commercial stocks fell during the week to 1.5765 mmt, 3.6% below the volume reported in week 36 for the 2020-21 crop year and 18.5% higher than the three-year average.
When the estimate for 2021 production is considered, along with the July 31, 2021 farm stocks estimate, 83.5% of available farm supplies have been delivered into the licensed system during the 36 weeks, which compares to 73.3% delivered in the same period of 2020-21 and the three-year average of 63.8%.
This bears watching during upcoming weeks. Exports and crush will soon need to slow considerably if current estimates are accurate or the alternative is that Statistics Canada revises stocks higher when March 31 stocks are released on May 6.
Cliff Jamieson can be reached at cliff.jamieson@dtn.com
Follow him on Twitter @Cliff Jamieson
(c) Copyright 2022 DTN, LLC. All rights reserved.

Comments
To comment, please Log In or Join our Community .