Canada Markets
The USDA Hints at What May Come in Global Wheat Markets
The USDA's March World Agricultural Supply and Demand Estimates (WASDE) report began with the following warning:
"Russia's recent military action in Ukraine significantly increased the uncertainty of agricultural supply and demand conditions in the region and globally. The March WASDE represents an initial assessment of the short-term impacts as a result of this action."
This begins the process of forecasting how global demand and supply chains will shift due to war between two of the eight largest wheat exporters in the world.
P[L1] D[0x0] M[300x250] OOP[F] ADUNIT[] T[]
The USDA showed only modest demand destruction due to prices and availability of wheat, with the domestic consumption total falling by 800,000 metric tons, to 787.28 million metric tons (mmt), still a record and up 0.6% from 2020-21. While this does not reflect huge demand rationing, USDA commentary notes lower import demand for Turkey, Egypt, the EU, Afghanistan, Algeria, Kenya, Pakistan, Tanzania and Yemen, due to "Black Sea wheat export availability and higher world prices." And so, it begins.
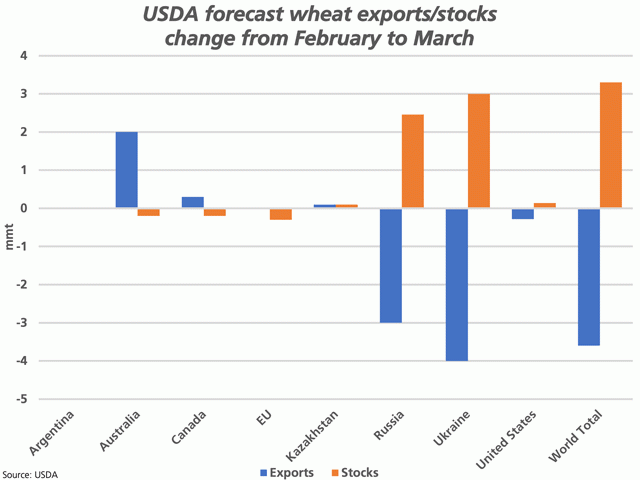
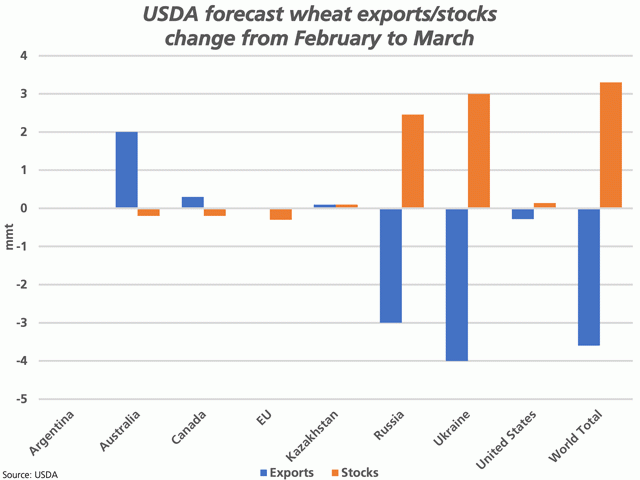
The USDA's first look at this situation resulted in a 3-mmt lower revision for Russia's 2021-22 exports and an additional 4-mmt drop in Ukraine's potential, as seen by the blue bars on the attached chart that includes the eight major global exporters. Of this group, a 2-mmt hike in Australia's export potential was shown due to recent official data released by ABARES that revised production higher. The next largest month-over-month increase in export potential seen on this chart is achieved by Canada, with the USDA revising higher Canada's export potential by 300,000 mt to 15.5 mmt, 150,000 mt higher than the Agriculture and Agri-Food Canada's most recent estimate.
Not shown on this chart is India, which is outside of the group of eight major exporters, with the export forecast increased by 1.5 mmt, to 8.5 mmt this month. Current estimates show India poised to outship Kazakhstan this crop year to become the eighth largest global exporter.
Beyond this crop year, this situation becomes more challenging. Interesting comments are seen from Jay O'Neil, Senior Agricultural Economist at Kansas State University. His rough calculations indicate that Russian exports will continue to "seep out into areas of need." At the same time, the world's challenge may be to replace approximately 24 mmt of Ukraine's exports for 2022-23, which he concluded cannot happen. He goes on to say that countries such as the U.S., Canada, Australia and European Union may come up with an extra 19 mmt from stocks held, leaving a 5 mmt-to-6 mmt shortfall. As a result, countries short on cash will drop to the bottom of the list of potential customers.
Cliff Jamieson can be reached at cliff.jamieson@dtn.com
Follow him on Twitter @Cliff Jamieson
(c) Copyright 2022 DTN, LLC. All rights reserved.


Comments
To comment, please Log In or Join our Community .