Canada Markets
Spring Wheat's Long-Term Resistance
Reaching fresh contract highs this session, both the May soft red winter wheat contract and the May hard red winter wheat contract hit their highest trade since 2008 after locking at their respective 50-cent daily limit.
May spring wheat closed 59 3/4 cents higher at $10.53 3/4/bushel (bu), the largest one-day move seen over the life of the contract, to the highest close realized during the life of the contract while ending 9 cents below the contract high reached on Feb. 24.
P[L1] D[0x0] M[300x250] OOP[F] ADUNIT[] T[]
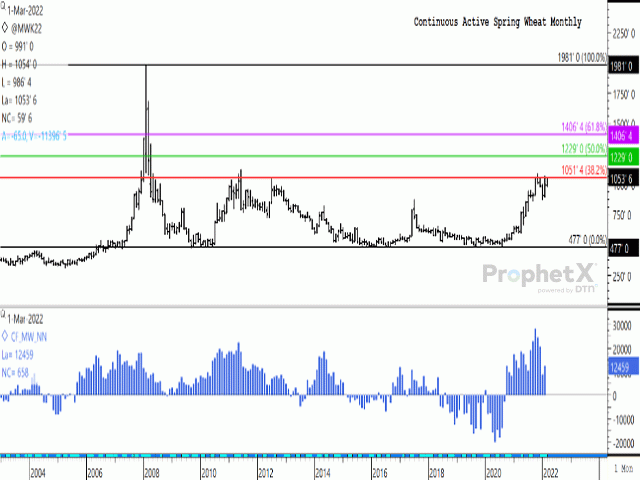
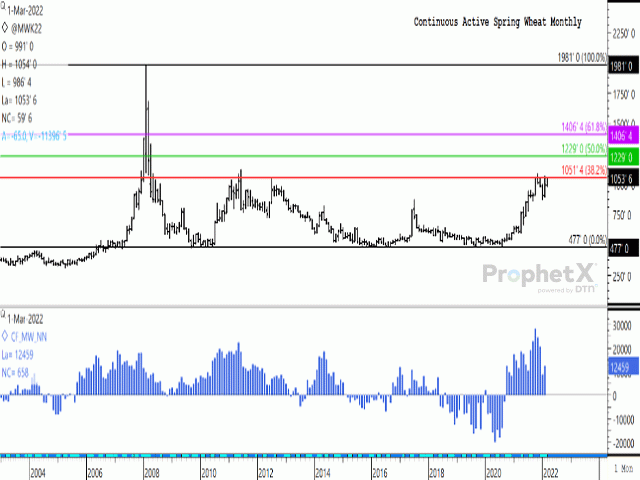
The attached long-term continuous active monthly chart shows current price testing long-term resistance at $10.51 1/2/bu, with today's close holding above this level. This resistance represents the 38.2% retracement of the move from the February 2008 high of $19.81/bu and the September 2009 monthly low of $4.77/bu. From this chart, we see that this resistance posed a challenge for prices in the February-through-June period of 2011, while again in July 2012. It has also more recently posed a challenge since October of 2021, when the monthly close was a modest 3/4 cents higher but failed to sustain the gains.
As seen on the chart, a breach of the $10.51 1/2 level could lead to a further move to the 50% retracement, calculated at $12.29/bu, as indicated by the horizontal green line.
The lower study on this chart shows the monthly noncommercial net-long position, which increased by 42.3% during the month of February, the first monthly increase seen in four months after reaching a record high in the month of October 2021. While not shown, the weekly chart shows this bullish position growing larger in three of the past four weeks.
Cliff Jamieson can be reached at cliff.jamieson@dtn.com
Follow him on Twitter @Cliff Jamieson
(c) Copyright 2022 DTN, LLC. All rights reserved.


Comments
To comment, please Log In or Join our Community .