Canada Markets
AAFC's February Supply and Demand Estimates
This month's government supply and demand estimates included information from Statistics Canada's Dec. 31 grain stocks report that was released on Feb. 8, 2022. The Statistics Canada report showed total grain stocks for the principal field crops falling by 30.8% year-over-year, with stocks of all crops except corn also falling year-over-year.
The largest changes in this month's report are a 1 million metric ton (mmt) increase in forecast corn imports, a 1 mmt drop in forecast wheat exports, along with a 1.166 mmt increase in domestic use across all crops. This month's estimate included a 635,000 metric ton (mt) increase in ending stocks of all principal field crops to 8.250 mmt, which included a 500,000 mt increase in wheat ending stocks (excluding durum).
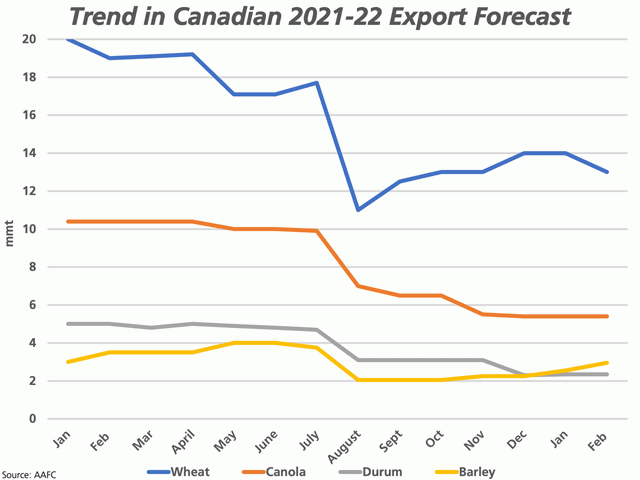
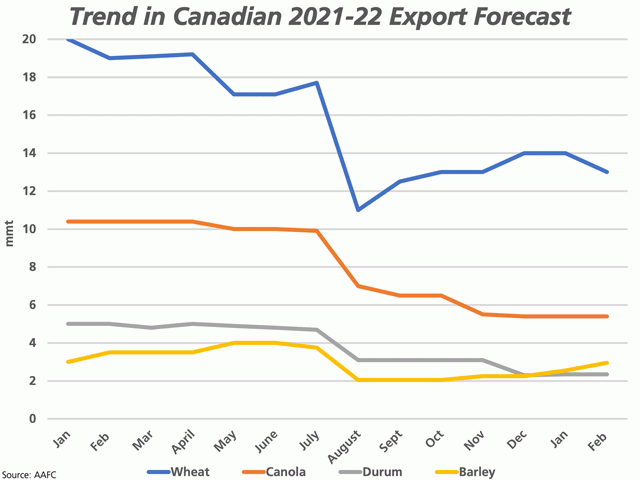
This month's estimates included a 1 mmt lower revision in forecast wheat exports, from 14 mmt to 13 mmt, as seen by the blue line on the attached chart. This is a return to the forecast held over the October/November period. Week 28 licensed exports were reported at 309,000 mt and were very close to the volume needed for the week to reach the higher forecast, although this was the first time in four weeks that the weekly volume was close to reaching the volume needed for the week to reach the 14 mmt forecast and the government is clearly seeing signals that exports will slow.
P[L1] D[0x0] M[300x250] OOP[F] ADUNIT[] T[]
This bears watching. As of week 28, licensed exports are 1.164 mmt behind the steady pace needed to reach the previous 14 mmt forecast, which excludes unlicensed exports and the export of flour. At the same time, over the past five years, an average of 48.2% of total crop year exports were achieved as of week 28, which signals exports are slightly weighted to the latter half of the crop year. As well, the current conflict between Russia and Ukraine could lead to altered trade patterns over the balance of the crop year.
This month's wheat estimates also includes a 459,000 metric ton (mt) increase in feed wheat disappearance, a residual number meant to keep the supply/demand balance in check, while ending stocks were increased by 500,000 mt to 3.5 mmt.
AAFC's barley balance sheet continues to see a lower revision for domestic consumption along with an upward revision for Canada's barley export potential, with ending stocks of 300,000 mt a historic low and unchanged from the previous month. This month's estimates saw domestic use fall by 400,000 mt, with a 300,000 mt lower revision in domestic feed use and a 100,000 mt drop in estimated food and industrial use. This revision is off-set with a 400,000 mt increase in estimated exports to 2.950 mmt, down 31% from 2020-21, while crop year supplies are 35% lower year-over-year.
Week 28 barley exports of 72,200 mt was the largest volume shipped in eight weeks, while cumulative exports through licensed exports are 25% below the same period last crop year, but still ahead of the revised forecast pace.
As domestic barley usage is revised lower, the estimate for wheat disappearance and the forecast for corn imports is being revised higher. Both the USDA and AAFC have taken turns ratcheting their forecast higher for Canada's import potential, with AAFC revising their forecast by 1 mmt higher to 4 mmt, which is approaching the 4.1 mmt record set in 2002-03. It is important to note that as of Feb. 10, the USDA reported 1.826 mmt of outstanding sales to Canada and 1.595 mmt of exports, or 3.4 mmt already on the books in just over five months.
The largest increases in domestic consumption are seen in a 1 mmt increase in corn disappearance along with wheat disappearance, offset by reduced barley use. In addition, there is a 200,000 mt increase in the feed/waste and dockage estimate for soybeans.
Cliff Jamieson can be reached at cliff.jamieson@dtn.com
Follow him on Twitter @Cliff Jamieson
(c) Copyright 2022 DTN, LLC. All rights reserved.


Comments
To comment, please Log In or Join our Community .