Canada Markets
Has March Spring Wheat Hit a Wall?
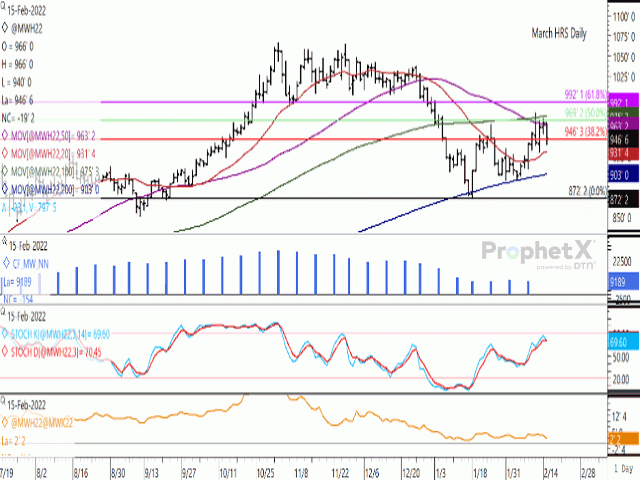
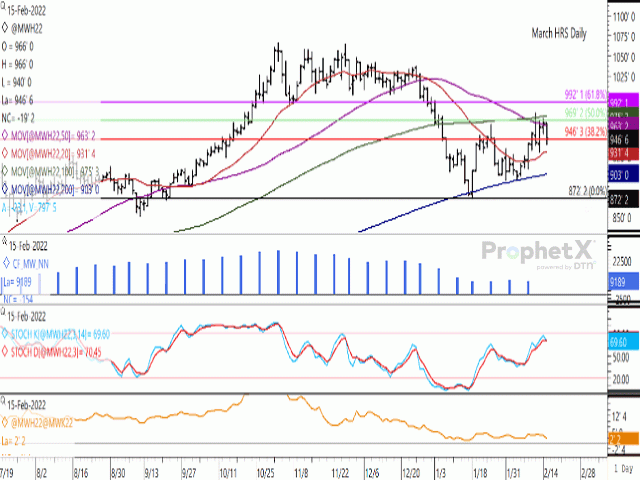
On Jan. 31, we noted a bearish outside reversal bar in this space on the March MGEX spring wheat chart, while a second bearish reversal bar was printed just two days later on Feb. 2. The Feb. 3 low resulted in a bounce from the contract's 200-day moving average. This move was followed by four consecutive gains totaling 53 cents, while on the fifth day, or Feb. 10, the March gained 25 cents to reach an intra-day high of $9.78 3/4/bushel (bu), only to reverse direction and close 11 1/2 cents lower.
During the four sessions including Feb. 10, 11, 14 and 15, session highs have struggled with the 50% retracement of the move from the November high to January low, calculated at $9.69 1/4, the contract's 50-day moving average at $9.63 1/4/bu as well as the 100-day moving average of $9.75 1/4/bu.
The blue bars on the first study show noncommercial traders reaching an all-time high net-long position of 29,470 contracts as of Nov. 2. The speculative side of the trade have since been pared, with the size of this bullish position falling in 11 of the past 14 weeks. As of Feb. 8, this position was 9,189 contracts, close to the smallest net-long position seen since April 6, 2021.
The stochastic momentum indicators seen in the middle study are seen rolling over, while just below the overbought region of the chart. Since reaching the contract high on Nov. 2, these momentum indicators have trended higher on four occasions, reaching a peak on Nov. 26, Dec. 23, Jan. 25 and again on Feb. 14, while failing to reach overbought territory.
P[L1] D[0x0] M[300x250] OOP[F] ADUNIT[] T[]
The lower study shows the March/May futures spread continuing to reflect a bullish inverse of 2 1/2 cents. This spread has largely traded sideways since the beginning of 2022, continuing to reflect a bullish inverse. During the past five years, trade on this day point to a bullish inverse in only one year, or in 2019, while the five-year average spread is minus 5 1/4 cents on Feb. 15.
Along with many other commodities, the move in wheat has been precipitated by ideas of potential war between Russia and Ukraine, which no one wants to see happen. Should the de-escalation reported in Feb. 15 media reports continue, we could soon see prices testing recent lows.
Watch for a test of the $8.95 1/2 to $8.96 1/2 levels, while a breach of this level could lead to a full retracement to the 2022 low of $8.72 1/4/bu.
**
DTN 360 Poll
This week's DTN 360 poll asks your opinions about your approach to secure herbicide supplies for 2022. Please weigh in with your thoughts; you can find the poll on the lower-right side of your DTN Home Page.
Cliff Jamieson can be reached at cliff.jamieson@dtn.com
Follow him on Twitter @Cliff Jamieson
(c) Copyright 2022 DTN, LLC. All rights reserved.


Comments
To comment, please Log In or Join our Community .