Canada Markets
Canada's Wheat Shipments by Month
In a discussion surrounding falling wheat prices, a producer asked about the seasonality of Canada's wheat shipments and whether this could be a bullish factor for prices as we move further into the crop year.
This may be a difficult year to make any conclusions due to Canada's tight supplies and a forecast 32.2% drop in wheat exports (excluding durum), along with actions taken by Russia to slow exports with export taxes approaching USD$100/metric ton, while Russia's increasing rhetoric over its relations with eastern Europe could also lead to a market disruption prior to the end of the crop year.
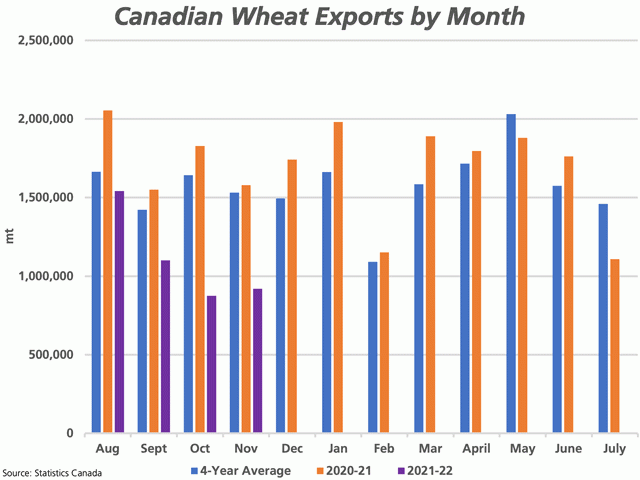
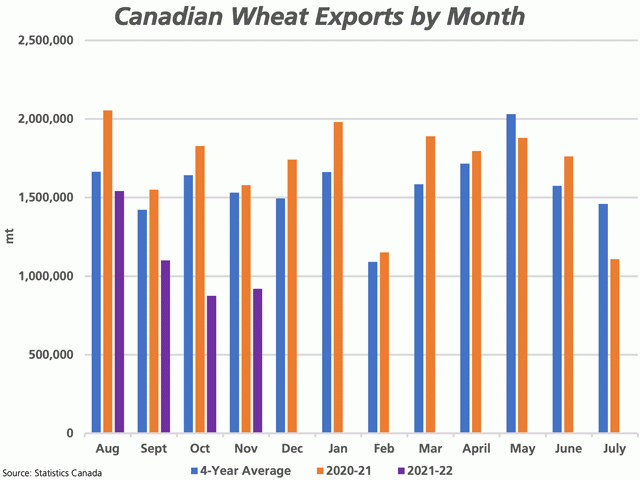
The attached chart shows shipments by month for 2021-22 (purple bars), 2020-21 (brown bars) and the four-year average (2017-18 though 2020-21).
P[L1] D[0x0] M[300x250] OOP[F] ADUNIT[] T[]
In 2020-21, the largest volume shipped in any single month was the first month of the crop year, or August, at 2.054 million metric tons (brown bar). At the same time, the highest blue bar points to a four-year average of 2.031 mmt of shipments in the month of May (blue bar).
If we compare shipments from August through December to shipments from January through July, we see that during the past four years, shipments in the latter months of the crop year range from 23.8% to 41.5% higher than the first five months of the crop year, averaging 30.2% higher.
As seen with the blue bars on the attached chart, activity in the three months from March through May is higher than other three-month periods. During the past four years, this period has accounted for 27.4% to 29.1% of total crop year exports.
For comparison, during the past four years, from 22.7% to 26.7% has been shipped in the first quarter of the crop year (August to October), and from 21.4% to 26.1% has been shipped in the second quarter (November to January).
Prior to reaching the increased movement in the March-to-May period, we see that exports tend to dip in February, both in 2020-21 and on average during the past four years. We may be seeing early signs of this dip, with only three grain vessels cleared from West Coast ports in week 23, while there are indications from the AG Transport Coalition that week 24 demand for hopper cars by major shippers is expected to be down by 50%, despite the more favourable prairie temperatures.
Cliff Jamieson can be reached at cliff.jamieson@dtn.com
Follow him on Twitter @Cliff Jamieson
(c) Copyright 2022 DTN, LLC. All rights reserved.


Comments
To comment, please Log In or Join our Community .