Canada Markets
Canola's Contract Highs Invite Selling
Watching the canola market is not for the faint of heart. Canola's fundamentals remain bullish, and focus may quickly shift to the dry prairie conditions and the potential for 2022. Thomas Elder Markets in Australia released a study on social media titled Is Canola a ticking time bomb? -- pointing to combined 2021-22 ending stocks of canola/rapeseed for Canada, Australia and European Union of 1.8 million metric tons (mmt), the lowest since 2003.
At the same time, there are ongoing concerns of canola being overpriced relative to soybeans, leaving the speculative traders on edge, especially given that they held the largest noncommercial net-long position on record as of the Dec. 14 CFTC data release.
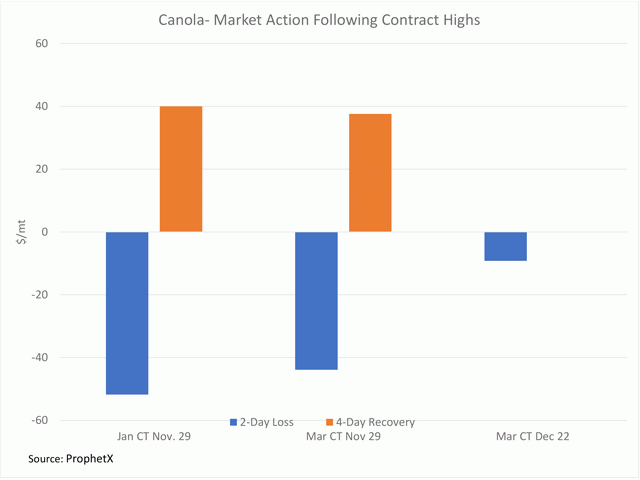
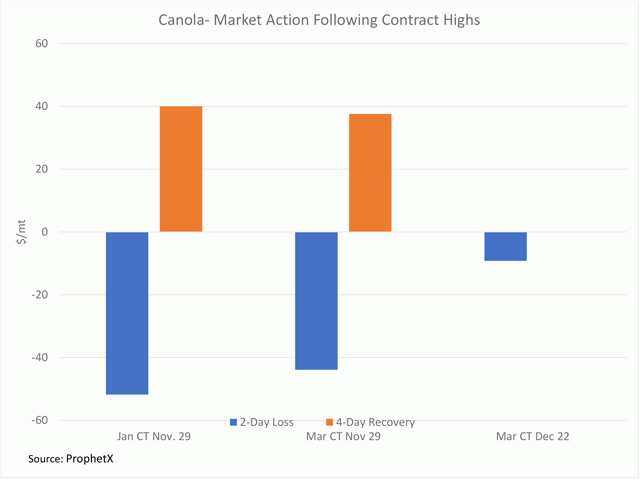
The attached chart shows an interesting pattern of trade on the ICE Canada futures during the past month. On Nov. 29, both the January and March contracts reached contract highs, only to face resistance and close lower for the session. For both contracts, selling continued the following day, for a two-day loss of $51.80/mt for the January contract and $43.90/mt for the March contract. This is shown by the first two blue bars on the chart.
P[L1] D[0x0] M[300x250] OOP[F] ADUNIT[] T[]
The move was then followed by four consecutive higher closes that saw the January contract climb $40/mt and the March gaining $37.60/mt, while not shown, on significantly lower volume. Selling quickly dried up, with the average volume over the four days of higher closes 24% lower than the two days of selling for the January contract, while 32% lower for the March contract.
The last blue bar shows the March contract reaching a fresh contract high of $1,020.50/mt on Dec. 22, only to close the session $2.20/mt lower. Dec. 23 trade shows a further loss of $7/mt, consistent with the pattern seen in late November, for a two-day loss of $9.20/mt.
One positive factor is that the two-day correction of $9.20/mt this week is significantly lower than seen in late November. The March price has dipped below $1,000/mt in three of the four sessions this week but has recovered to close above this level each time. As well, the March posted a weekly gain this week, although modest at $1/mt, for a second consecutive higher close on the weekly chart.
Next week's trade will indicate if buyers will take charge, although light holiday trade may play a role.
Cliff Jamieson can be reached at cliff.jamieson@dtn.com
Follow him on Twitter @Cliff Jamieson
(c) Copyright 2021 DTN, LLC. All rights reserved.


Comments
To comment, please Log In or Join our Community .