Canada Markets
SRW May be Signaling More Bad News for the Wheat Market
The sharp 31-cent drop seen in the Chicago soft red winter wheat contract on Dec. 15, which was accompanied by a 26 1/4-cent crop seen for hard red winter and 11 3/4-cent drop in the nearby hard red spring wheat contract has created a stir among wheat market watchers around the world as a hunt for clues that triggered or justified the move continues.
Dec. 16 trade saw spring wheat recoup the previous session's losses, while HRW and SRW clawed back a significant portion of the previous day's move.
P[L1] D[0x0] M[300x250] OOP[F] ADUNIT[] T[]
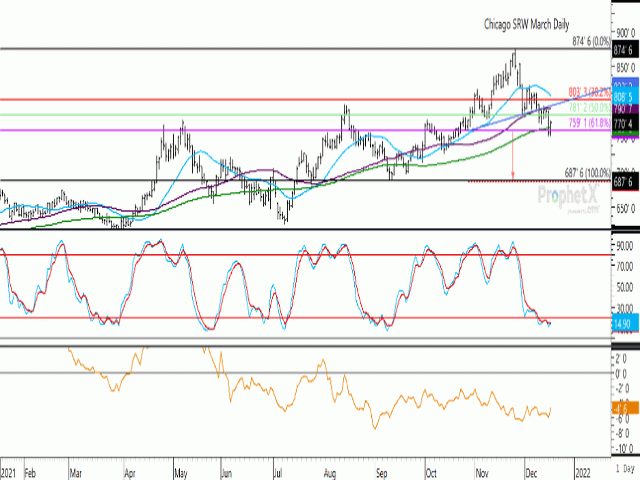
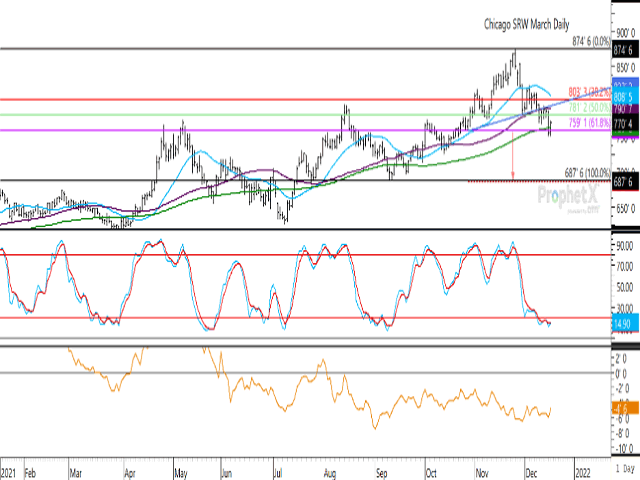
One debate on social media today is that the most active SRW chart may have been sending a bearish signal during the past week, with the breach of the neckline of a head and shoulders pattern on Dec. 9. As seen on the attached chart, this pattern is formed with the left shoulder on Nov. 2 at $8.18/bushel (bu), the right shoulder on Dec. 3 at $8.22 3/4/bu, and the head reached at the Nov. 24 contract high of $8.74 3/4/bu.
The measuring ability of this pattern would signal a return to the red dotted line shown at $6.85 1/4/bu, which also signals a retracement to the September low of $6.87 3/4/bu.
The Dec. 15 close was below the contract's 100-day moving average for the first time since Sept. 24, while it also breached the contract's 61.8% retracement of the move from the September low to November high. The breach of both support levels may have triggered stops that could have led to a further downside, although buying interest led to a higher close on Thursday.
Cliff Jamieson can be reached at cliff.jamieson@dtn.com
Follow him on Twitter @Cliff Jamieson
(c) Copyright 2021 DTN, LLC. All rights reserved.


Comments
To comment, please Log In or Join our Community .