Canada Markets
Statistics Canada Reduces Canada's Crop Production
The December Statistics Canada crop production estimates pointed to severe weather conditions on the Prairies during the growing season that led to overall crop production being revised lower.
Total production of principal field crops is estimated at 69.7 million metric tons (mmt), down 30.2% from last crop year and 27% below the five-year average. When this calculation is made using prairie province data, production is down 40% year-over-year based on today's estimates at 46.7 mmt, while down 36.9% from the five-year average.
There is no surprise in the sharp drop, which was confirmed in previous Statistics Canada data along with provincial government reports, with Statistics Canada reporting in September that the Normalized Difference Vegetation Index (NDVI), a measure of plant health, peaked as much as four weeks earlier than normal due to the hot and dry conditions faced this summer.
There are a few things to note about today's report:
1) This is the last of three production estimate reports released by Statistics Canada this crop year, although the agency can revise data for up to two years.
2) This is the first report this season based on producer surveys. The previous two reports were based on models analyzing July and August conditions, while in past years, the first report of the year has also been based on producer surveys.
3) This report includes estimates for all provinces. The previous two reports based estimates on historical averages for small grain producing provinces such as the Maritime provinces, which is reported to account for 2% to 4% of total production.
4) The December report includes the most accurate estimates of harvested acres. Previous reports used historical averages for abandoned acres, which we know is not accurate due to the rush to salvage some poor crops for feed this crop year.
5) This report comes at a time when supplies for many crops are extremely tight and ending stocks for many crops were estimated at all-time lows prior to the release of today's report.
Today's all-wheat estimate was released at 21.652 mmt, down 38.5% from last year and 33.5% from the five-year average, the lowest all-wheat production since 2007. This estimate was a modest 62,800 metric tons lower than reported in the September estimate based on the August model, while when rounded to one decimal place, the estimate is 21.7 mmt, unchanged from the previous estimate. Canada's crop year supplies are calculated at 27.565 mmt, down 32.5% from last year. This compares to the 2020-22 record exports of all-wheat at 26.4 mmt, which shows just how tight supplies are.
P[L1] D[0x0] M[300x250] OOP[F] ADUNIT[] T[]
Drilling further into the wheat data, Statistics Canada revised higher its forecast for spring wheat harvested acres (268,300 acres) and yield (1 bushel per acre) to revise production higher from the previous estimate by 688,000 metric tons (mt), to 16.009 mmt. By no way is this bearish news -- total spring wheat production is down 38% from 2020-21 and 32.8% below the five-year average.
This is Statistics Canada's first look at spring wheat production by class. Hard red spring wheat production was reported at 13.203 mmt, down 40% from the previous year. Hard red spring wheat production accounted for 82.5% of total spring wheat production, which is the lowest percentage calculated in eight years. This compares to 84.9% calculated for 2020 and the five-year average of 84.6%.
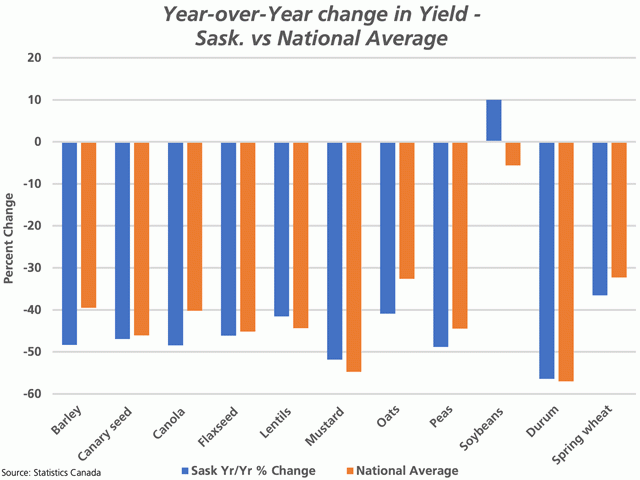
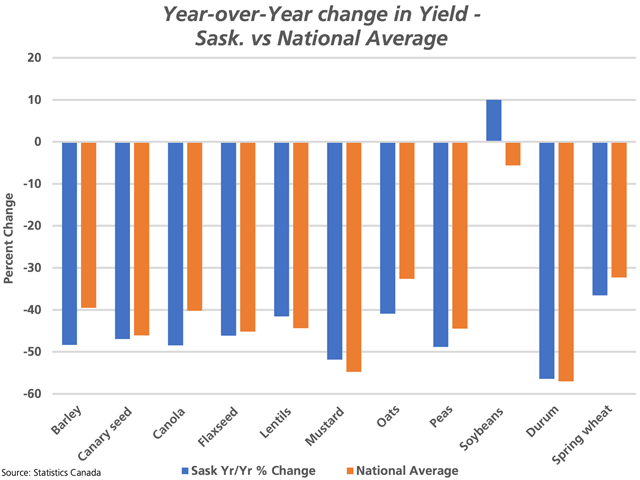
The major adjustment in today's data was seen for durum. Durum production was revised by 891,100 mt lower from the previous estimate to 2.654 mmt, down 59.6% from last year and 55.9% below the five-year average. As seen on the attached chart, the Saskatchewan yield did not fall quite as much year-over-year as the national yield, which points to a larger revision lower made for Alberta this report.
The agency's durum harvested acre estimate was revised 71,100 mt lower this month, while the average yield was revised lower by a whopping 5.8 bpa to 18.3 bpa across the Prairies. This is the smallest durum crop in Statistics Canada data going back to at least 1991, possibly a lot longer. Exports will be substantially curtailed from the 5.773 mmt shipped in 2020-21.
There has been much discussion surrounding acres lost as they were salvaged for feed. In October, the USDA's World Agricultural Production report used an estimate of Canada's abandoned wheat acres of 10.5%, while at a time when Agriculture and Agri-Food Canada (AAFC) was using an average abandonment level of 3.4%. Today's report did not satisfy those looking for a sharp revision in this estimate. Canada's all wheat abandonment is estimated at 4.1%, which compares to the five-year average of 3.3%. This bears watching and could suggest that wheat stocks are even tighter than shown today.
As expected in at least some pre-report estimates, Statistics Canada revised canola production slightly lower, down 186,900 mt from the previous estimate to 12.595 mmt. This is down 35.4% from last year and 37.8% from the five-year average. A lower revision of any size can be viewed as a bullish event from an already tight balance sheet. Modest revisions lower were made to both harvested acres and yield, with the average yield estimated at 25 bpa, down from last year's 41.8 bpa.
Crop year supplies of canola are estimated at 14.5 mmt, down 37% from 2020-21 as well as from the five-year average. It is interesting to note that as of week 17, the pace of both exports and crush is ahead of AAFC's forecast pace, which points to tight supplies to hit the market sooner than expected. As of week 17, total disappearance is calculated at 5.566 mmt as reported by the Canadian Grain Commission, which accounts for 38.4% of total supplies in the first 32.6% of the crop year.
Oat production in Canada was tweaked slightly higher from the September estimate to 2.606 mmt, up 27,300 mt from the previous estimate, while national production is down 43% from 2020 and 32% below the five-year average. Harvested acres were revised slightly lower this month, while the national average yield was revised 1.5 bpa higher. Crop year supplies are estimated at 3.263 mmt, down 35% from one year ago and 27.7% below the five-year average.
Once again, today's data would indicate 80.3% of seeded acres were harvested, which is close to equal to the 80.5% five-year average. This forecast should be viewed with some degree of skepticism.
Canada's barley production was estimated 6.948 mmt, down 193,300 mt from the previous forecast, down 35.3% from last year and 24.9% below the five-year average. This is the smallest production seen in Statistics Canada data since 1967.
Barley supplies are estimated at 7.809 mmt, down 34.9% from last year and 26.9% below the five-year average. With current exports at a pace that is close to last year's pace, the feed use of barley will be curtailed sharply and lead to increased reliance on U.S. corn imports. As is pointed out for oats, today's calculation leads to abandoned acres of 10.6% of the total acres seeded, which again is close to equal to the five-year average of 10.3% abandoned. Again, this could lead to future revisions.
Lentil production was revised 196,300 mt lower in today's report to 1.606 mmt, the smallest lentil production reported since 2012. This is down 44% from last year and 39% below the five-year average. Crop year supplies are calculated at 2.088 mmt, which is lower than 2020-21 exports, down 34.5% from 2020-21 and 34.4% below the five-year average.
Dry pea production was estimated at 2.258 mmt, down 268,600 mt from the previous estimate, while the smallest dry pea production seen since 2003. This is 50.8% below the production realized one year ago and 47% below the five-year average. Crop year supplies are reported at 2.890 mmt, which again falls below 2020-21 exports, down 41.1% from last year and 38% below the five-year average.
Soybean production was estimated at 6.272 mmt, an upward revision from its earlier model-based estimate, while 1.4% lower than 2020 and 8.4% below the four-year average. Overall harvested acres were up 4.5%, while the national yield fell by 3.3 bpa from last year to 43 bpa. Of the largest producing provinces, Saskatchewan was the only one to see lower harvest acres year-over-year, while Manitoba added 161,900 mt or 14% to the already low acres harvested in 2020, the largest change of any province. Yield fell year-over-year in both Quebec (8.7%) and Manitoba (27.3%). Note at 51.6 bpa, the Ontario yield was a record for the province, while two private crop tours settled on a final weighted yield that is even higher.
Crop year supplies of soybeans are pegged at 6.966 mmt, down 7.3% from last year and 12.6% below the five-year average.
Corn production was estimated at 13.984 mmt, a downward revision or 384,100 mt from the September estimate, up 3.1% from last year and 1.6% higher than the five-year average. Harvested acres were down 1.3% across the country, with a small drop across each if the three major producing provinces. Average yield across the country increased by 6.7 bpa to 160.2 bpa, the highest in six years, with an increase in yield for Quebec and Ontario off setting a 26.7 bpa drop in Manitoba. The average yield for Ontario at 175.2 bpa is also the highest estimated yield on record, but also note that two private crop tours ended with an average yield of 191.5 bpa and 194.3 bpa, so production may still be under-stated.
Estimated crop year supplies are calculated at 19.153 mmt based on government estimates, 8.6% higher than in 2020-21 and 7.6% higher than the five-year average. Note that this forecast includes 3 mmt of U.S. imports, largely shipped to the western Prairies to offset reduced barley production, a forecast that could be revised even higher.
**
DTN 360 Poll
This week's poll, found on the lower-right side of your DTN Home Page, asks if you will consider pricing new-crop production? We value your opinion and thank you in advance for your response.
Cliff Jamieson can be reached at cliff.jamieson@dtn.com
Follow him on Twitter @Cliff Jamieson
(c) Copyright 2021 DTN, LLC. All rights reserved.


Comments
To comment, please Log In or Join our Community .