Canada Markets
A Look at Cumulative Canola Deliveries
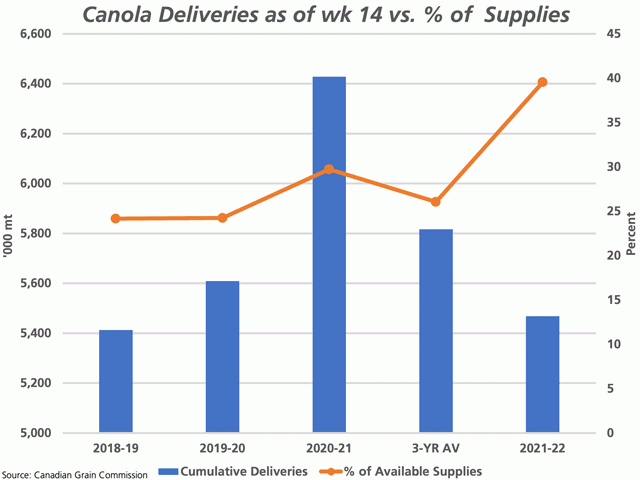
Canola deliveries remain brisk as of week 14 data, with favourable weather and prices supporting movement. In week 14, 451,300 metric tons were delivered into licensed facilities, the largest volume seen in three weeks. Cumulative deliveries over 14 weeks total 5.4683 million metric tons, which is down 14.9% from the same period last crop year despite the current production estimate that is down 34.4% year over year.
Despite an active shipment program as well as domestic disappearance relative to the size of the crop, commercial stocks remain high. In week 14, commercial stocks were reported at 1.678 million metric tons, up 1.8% from the same week last year, while 10.9% higher than the five-year average. As we head into the winter months, commercials are comfortable holding roughly four weeks of average weekly disappearance.
P[L1] D[0x0] M[300x250] OOP[F] ADUNIT[] T[]
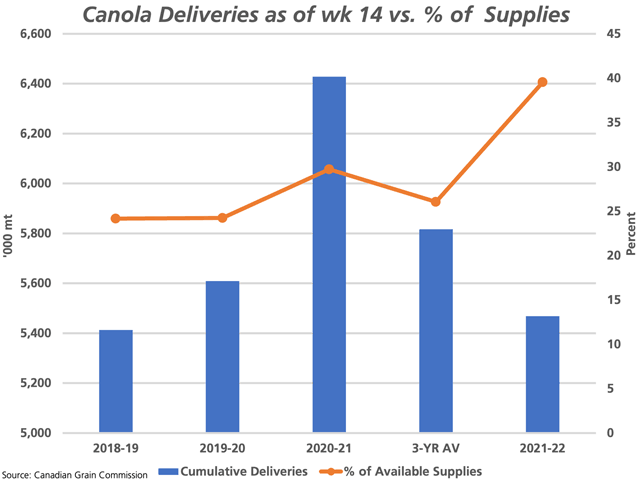
This will soon change. Weather will slow movement, while the number of open contracts will decline as we move into the crop year. As seen on the attached chart, during the past three years, cumulative deliveries into licensed facilities represented an average of 26% of total available supplies, calculated as the beginning farm stocks (July 31 stocks) plus estimated production. During the past three years, this has ranged from 24.2% in 2018-19 and 2019-20 to 29.7% in 2020-21, based on Canadian Grain Commission statistics on delivery and Statistics Canada stocks and production estimates.
As seen on the attached chart, an estimated 39.5% of available supplies have been delivered in the first 14 weeks or 27% of the crop year, based on current Statistics Canada estimates.
As supplies continue to tighten and winter weather grips the Prairies, buyers will quickly turn to basis as a tool to meet their needs should futures fail to provide the buying power needed.
Cliff Jamieson can be reached at cliff.jamieson@dtn.com
Follow him on Twitter @Cliff Jamieson
(c) Copyright 2021 DTN, LLC. All rights reserved.


Comments
To comment, please Log In or Join our Community .