Canada Markets
Primary Elevator Deliveries, Shipments by Province
The week 13 Grain Monitoring Program Weekly Performance Update reports country stocks of grain at 4.0313 million metric tons (mmt) as of week 13 or Oct.31. This is down 9% from the same period last crop year while 2% higher than the three-year average. This represents 74% of the estimated Prairie working capacity of 5.420 mmt.
What jumps out in this data is that Manitoba stocks are down 20% from last year and down 2% from the three-year average for the province. Saskatchewan stocks are down 17% from last year and down 5% from the three-year average. Meanwhile, Alberta stocks of all crops are up 11% from last crop year and 15% above the three-year average, which is shown to represent 87% of estimated working capacity.
P[L1] D[0x0] M[300x250] OOP[F] ADUNIT[] T[]
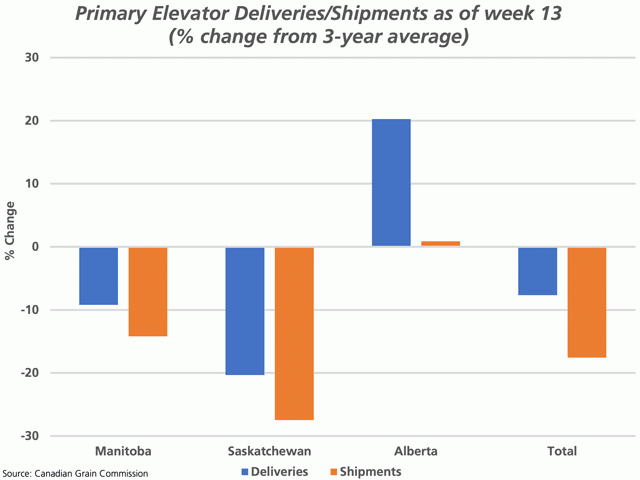
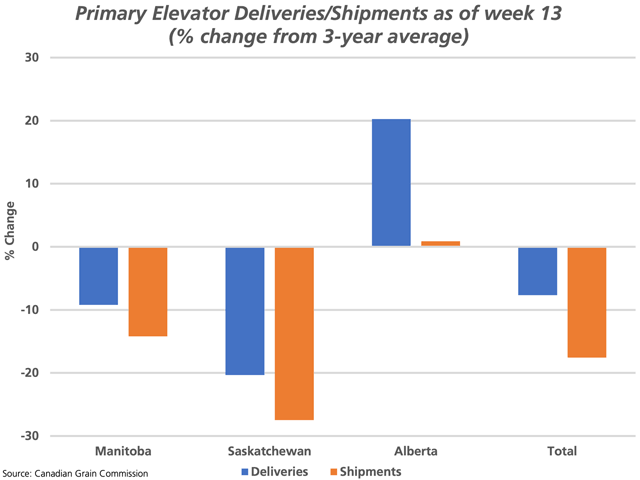
With this data in mind, we look further at the Canadian Grain Commission's week 13 statistics. The blue bars on the attached chart represent cumulative deliveries of all crops into licensed facilities as of week 13 as a percent change from the three-year average. Cumulative deliveries are down 9.2% in Manitoba from average and down 20.3% in Saskatchewan, while down 7.6% on average across the Prairies.
At the same time, deliveries in Alberta facilities are up 20.3% from the three-year average. This could be partially due to an earlier harvest when compared to recent years, higher cash prices due to proximity to the West Coast and higher than average pace of shipments that creates space. A quick look at the two largest crops, wheat and canola, shows producer deliveries of wheat into primary elevators in Alberta are up 2.5% in the first 13 weeks or the first quarter of 2021-22, while deliveries of canola were up 40% from average, a volume that is higher than achieved in each of the past three years.
The brown bars represent cumulative shipments from primary elevators over the 13 weeks, also calculated as a percent change from the three-year average. While Manitoba shipments are down 14.2%, Saskatchewan shipments are down 27.5% and Alberta shipments are up .9% from average. This bears watching.
Cliff Jamieson can be reached at cliff.jamieson@dtn.com
Follow him on Twitter @Cliff Jamieson
(c) Copyright 2021 DTN, LLC. All rights reserved.


Comments
To comment, please Log In or Join our Community .