Canada Markets
November Canola Consolidates Ahead of Harvest
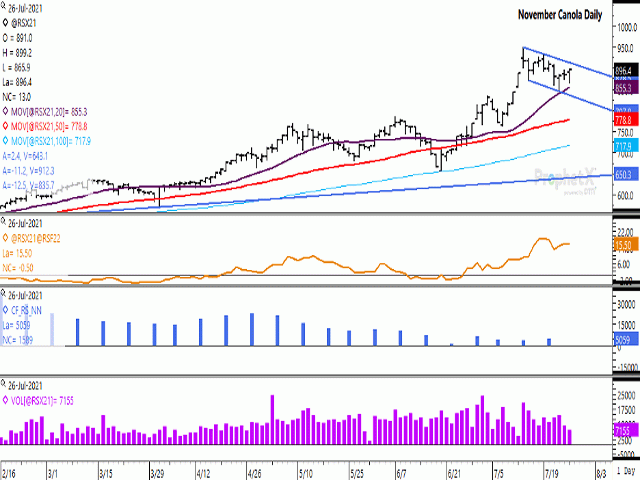
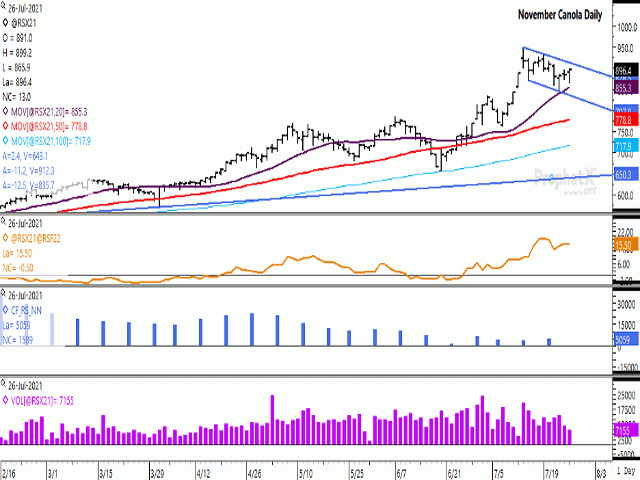
Monday's close resulted in late-session buying interest that drove the November contract higher for a third session, ending up $13/mt at $896.40/metric ton. The session's high came within $0.80/mt of testing $900/mt.
Over the past four sessions, the November contract has closed within a narrow $16.50/metric ton range, despite trading over a much wider $64.30/mt trading range.
The daily chart shows a bullish flag pattern formed in recent trade, viewed as a trend that runs counter to a short-term trend. As seen on the attached chart, a short-term uptrend was seen with a move from the July 7 low of $762/mt to the July 13 high of $949/mt, which has since led to a period of reflection on the part of traders. Trade has been bound by the downward-sloping channel or flag, a period of consolidation, as indicated by the two downward-sloping blue bars.
P[L1] D[0x0] M[300x250] OOP[F] ADUNIT[] T[]
Resistance on this flag is seen at $912.30/mt while support is seen at $835.70/mt. Technical analysis theory would indicate that a breach of the upside target of $912.30/mt would result in a continued move in the direction of the original uptrend, also known as the flagpole. This totals $217/mt, pointing to an upside target of $1,129.30/mt.
The brown line on the first study indicates the November/January futures spread or inverse of $15.50/mt, signaling a continued bullish view of market fundamentals despite weakening modestly on Monday. While not shown, the Nov/July spread has strengthened to a $77.90/mt inverse on Monday, slightly below the July 19 high of $87.20/mt, while this spread has traded at a carry on this date in each of the past five years, averaging minus $19.26/mt or a $19.26/mt carry (July trading higher than the November).
The blue bars of the histogram in the lower study shows the noncommercial net-long position, with a modest increase seen in the July 20 position to 5,059 contracts, although this remains close to the smallest net-long position seen since this group turned bullish in August 2020. This position reached a record high of 62,432 contracts as of late December 2020. The question is when will this group step back in to buy and what will it take?
The November contract continues to hold well above its 20-day moving average, calculated at $855.30/mt on Monday (purple line on attached chart), while the upward trend of this moving average is a supportive feature.
Cliff Jamieson can be reached at cliff.jamieson@dtn.com
Follow him on Twitter @Cliff Jamieson
(c) Copyright 2021 DTN, LLC. All rights reserved.


Comments
To comment, please Log In or Join our Community .