Canada Markets
Acreage Changes From March to June Based on Statistics Canada Data
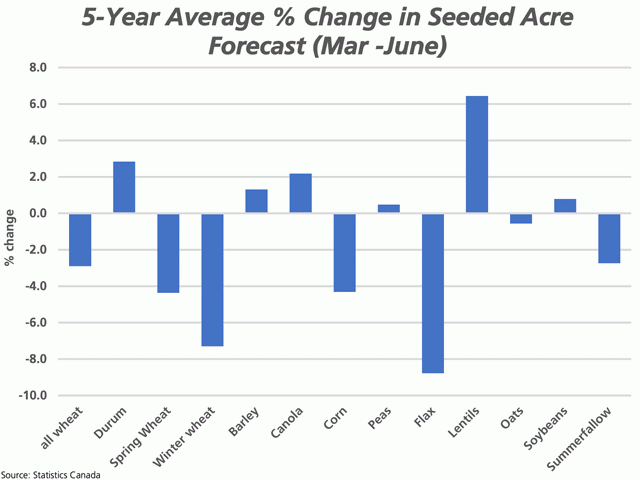
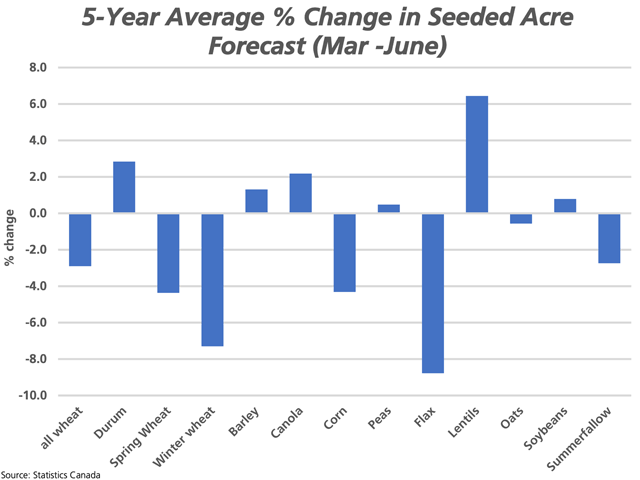
The attached chart shows the five-year average change in acres reported by Statistics Canada in April, based on producer surveys conducted in March (March intentions) and the final estimates reported in June.
In four of the past five years, Statistics Canada's final estimates released in June were reported lower for summerfallow, allowing for higher seeded acres. At the same time, the March intentions report estimated summerfallow acres at 1.604 million acres, the lowest in data reported by Statistics Canada going back to 1913, so potential gains in seeded acres will be smaller.
As seen on the chart, acres of durum, barley, canola, peas, lentils, and soybeans tend to be revised higher from the March report to the June report.
P[L1] D[0x0] M[300x250] OOP[F] ADUNIT[] T[]
Acres of durum have been revised higher in three of the past five years (2016-20), averaging a 2.8% increase. The estimate for barley has increased in three of the past five years, averaging 1.3% higher. During the past five years, the estimate for canola acres has been revised higher in four of the past five years, seen in the past three years and averaging a 2.2% increase. Dry pea acres have been revised higher in two of five years, while averaging a 0.5% increase. Lentil acres have been revised higher in four of five years, averaging 6.4% higher, with double-digit increases seen in three of the four years. Finally, soybean acres have been revised higher in three of the five years, increasing by an average of 0.8%.
Despite the increase seen in durum acres over this period, the estimate for acres of all-wheat, spring wheat and winter wheat fell in each of the five years in question from the March estimates to the June estimates. While the all-wheat acres fell by an average of 2.9% over this period, the spring wheat acres fell by an average of 4.4%. With spring wheat acres estimated at 16.4 million acres based on March intentions, already the lowest in four years, a lower revision could result in a blow to the wheat market with the U.S. spring wheat crop condition rated shown at its lowest rating seen since 1988.
Canada's corn acres have been revised lower over the period in question during each of the past five years, averaging a 4.3% drop from March to June. This year's results could diverge from this trend due to the corn rally that saw prices move higher during April to an early May high.
Statistics Canada is scheduled to release its June estimates on June 29 at 7:30 CDT.
Cliff Jamieson can be reached at cliff.jamieson@dtn.com
Follow him on Twitter @Cliff Jamieson
(c) Copyright 2021 DTN, LLC. All rights reserved.


Comments
To comment, please Log In or Join our Community .