Canada Markets
Old-Crop Spring Wheat Surges
Dry weather in the U.S. Northern Plains and Canadian Prairies continues to support spring wheat prices, while market watchers will look for Statistics Canada's views on seeded acres on April 27.
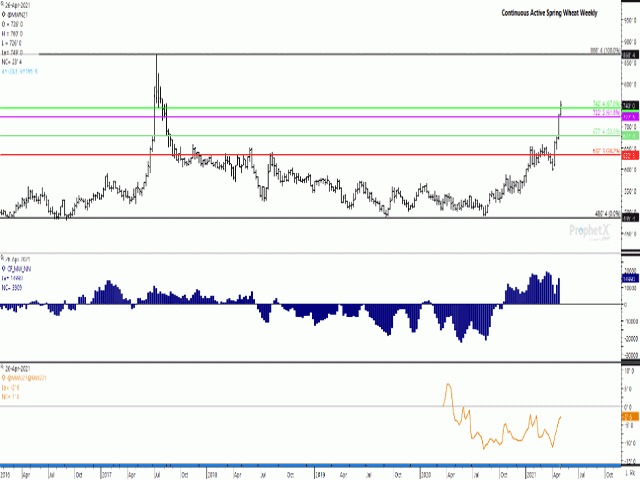
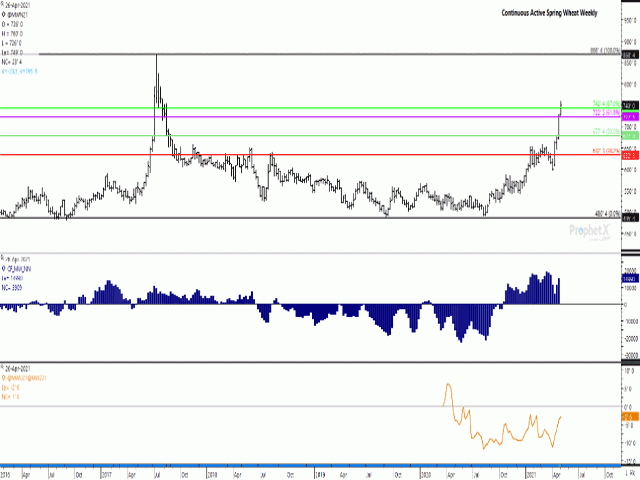
Since reaching its recent April 1 low of $6.06/bushel (bu), the July spring wheat chart has gained $1.43/bu or 23.6% to today's close, while the continuous active monthly chart (not shown) would indicate we are poised for the largest monthly move since June 2017 where the continuous chart shows a gain of $1.99 3/4/bu. This month's gain compares to 24.9% for July soft red winter wheat and 26.7% for July hard red winter.
P[L1] D[0x0] M[300x250] OOP[F] ADUNIT[] T[]
As seen on the attached continuous active chart, this month's move in the July future started with a breach of the 38.2% of the move from the July 2017 high to the September 2019 low at $6.32 1/4/bu, followed by last week's trade that has breached both the 50% and 61.8% retracement lines. The April 26 has breached the 67% retracement at $7.42 1/2/bu. This may open the door to a continued move to the 2017 high of $8.68 1/2/bu, based on retracement theory.
The blue bars of the histogram in the middle study shows the noncommercial net-long position increasing in the week ending April 19, a second straight weekly increase after falling for four consecutive weeks. Speculative interest has increased due to the dry outlook for the North American spring wheat area.
The lower study shows the new-crop September/December spread, which is also signaling a less-bearish view of market fundamentals early in new-crop positions. While this spread strengthened 1/2 cent to minus 3 1/4 cents this session, it traded as narrow as minus 2 cents this session. Chart resistance lies in a range from minus 2 1/4 to minus 2 1/2 cents on the spread chart.
Cliff Jamieson can be reached at cliff.jamieson@dtn.com
Follow him on Twitter @Cliff Jamieson
(c) Copyright 2021 DTN, LLC. All rights reserved.


Comments
To comment, please Log In or Join our Community .