Canada Markets
November Canola Rallies in the June-to-August Period
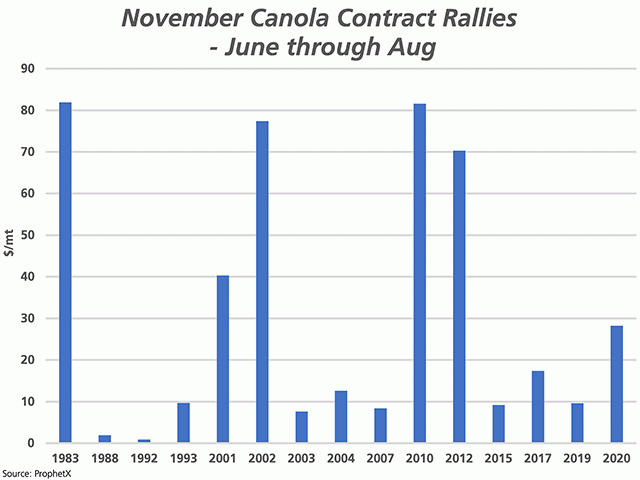
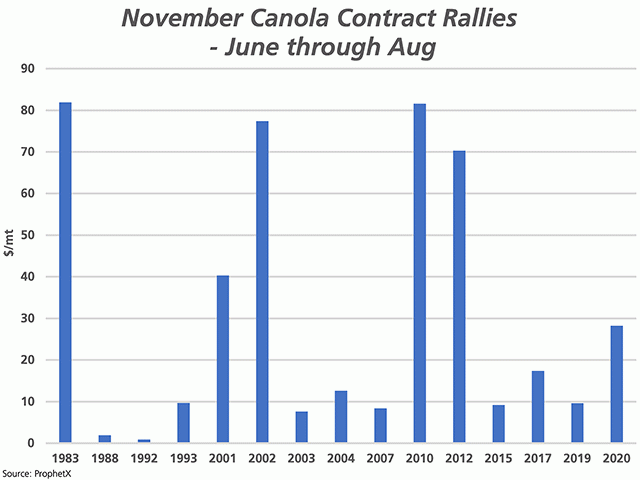
During the three months from June through August, the November canola contract rallied two years in the 1981-to-1990 period, two years in the 1991-to-2000 period, six years in 2001-to-2010 and five years from 2011-to-2020 period, including two of the biggest rallies seen during this 40-year period.
Looking at the most recent four years where the November contract rallied during the summer, July 31 ending stocks that falls during the June-through-August period of trade considered and for the crop year prior to the new-crop November contract, ranged from 1.342 million metric tons to 4.435 mmt in 2015, 2017, 2019 and 2020, while averaging 2.870 mmt.
P[L1] D[0x0] M[300x250] OOP[F] ADUNIT[] T[]
Since 2000, July 31 stocks fell below 1 mmt in just three of the years shown where the new-crop November contract was rallying during the summer, seen in 2002-03, 2003-04 and 2011-12. The lowest stocks seen on a year where the November contract rallied during the summer is seen in 2004 at 609,000 metric tons.
One year to consider is 2012, where 2011-12 stocks fell to 707,000 mt as of July 31, while the November rallied $70.30/mt during the June-through-August period, which is the fourth-largest summer rally seen on the attached chart. This level of stocks represented a single-digit stocks/use ratio of 4.4%, with the following crop year resulting in stocks falling further to 588,100 mt, or 4.2% of use. This was the last time that stocks/use ratios are calculated as back-to-back single-digit ratios, which is currently what is seen in Agriculture and Agri-Food Canada's estimates for 2020-21 and 2021-22.
Cliff Jamieson can be reached at cliff.jamieson@dtn.com
Follow him on Twitter @Cliff Jamieson
(c) Copyright 2021 DTN, LLC. All rights reserved.


Comments
To comment, please Log In or Join our Community .