

Canada Markets
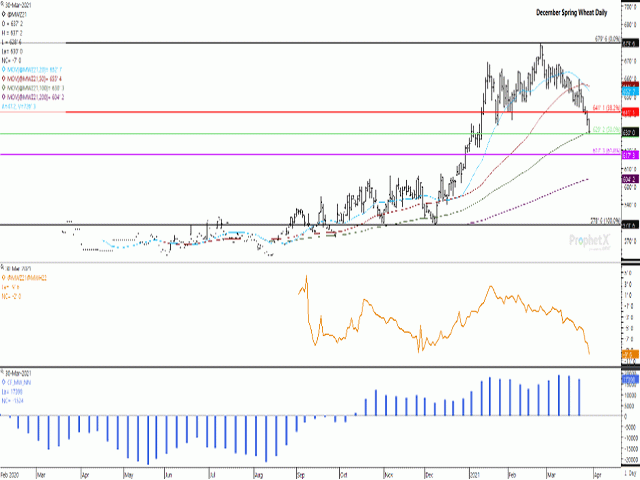
Dec. HRS Ends Lower, But Hesitates at Support
Despite an expectation that the USDA will show a reduction in spring wheat acres seeded this year when data is released on March 31, with a similar expectation held in Canada, new crop spring wheat futures are facing pressure.
December spring wheat closed 7 cents lower at $6.30/bushel (bu) on Tuesday, while reaching its lowest trade in more than 10 weeks.
This contract closed below the 38.2% retracement of the move from its December low to January high on the attached daily chart, while Tuesday's trade saw price dip below the 50% retracement level of $6.29 1/4/bu.
P[L1] D[0x0] M[300x250] OOP[F] ADUNIT[] T[]
The March 30 move also saw price dip below the contract's 100-day moving average for the first time since Dec. 9, while closing roughly 1/4-cent below this support.
While this could be viewed as a bearish close, the old-crop May contract closed well-below its 100-day moving average and 50% retracement line.
We know that noncommercial traders were sellers in this session ahead of Wednesday's reports, while the new-crop Dec/March futures spread seen in the first study shows this spread weakening to a 9 3/4-cent spread or carry this session, the weakest spread seen during the life of the contract. On average on this day over the past five years, this spread is seen at an 11.6-cent carry, ranging from minus 9 3/4 cents to minus 13 3/4 cents. The spread on this chart reached an inverse of 2 1/2 cents as of Jan.20 and traded as an inverse (December trading over the March contract) as recent as Feb. 9.
The blue histogram bars on the lower study shows noncommercial traders reducing their bullish net-long position in spring wheat futures in each of the past two weeks or as of March 23, which will be shown to continue for the following week when data is released on April 2. It is interesting to note that while the spring wheat net-long position is down 9% from its March high, the largest net-long held since June 2014, the most recent data shows the net-long position held in hard red winter wheat down 58.8% from its recent high and the same position for soft red winter wheat is down 60.9% from its recent high. Liquidation is taking place in all three markets, but at a far faster pace in winter wheat.
While the U.S. winter wheat crop shows improving crop ratings, the Northern Plains and Prairies remain largely dry while spring wheat struggles for acres against other crop choices. The March 31 data release may be key to determining if spring wheat can trade independently from winter wheat.
Cliff Jamieson can be reached at cliff.jamieson@dtn.com
Follow him on Twitter @Cliff Jamieson
(c) Copyright 2021 DTN, LLC. All rights reserved.
Comments
To comment, please Log In or Join our Community .