Canada Markets
November Canola's Technical Signals
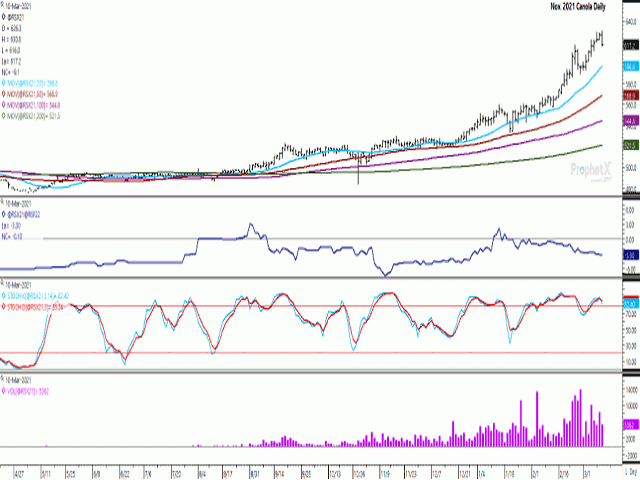
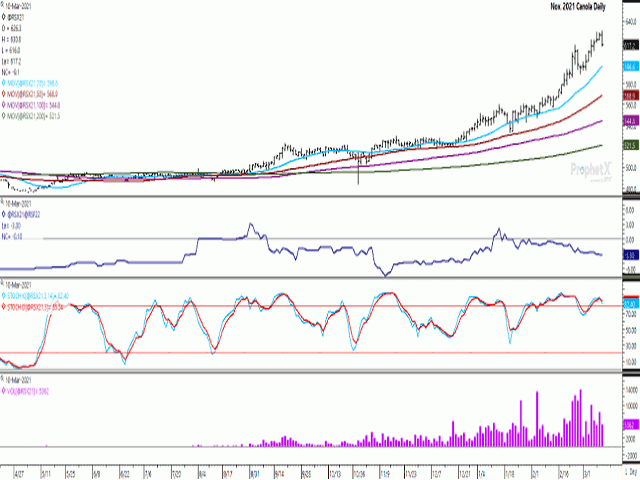
November canola closed $9.10/metric ton lower on Wednesday, at $617.20/mt, its first loss in eight sessions. Prior to turning lower, it reached its fifth consecutive contract high of $630.80/mt. Many will be looking for signs that this market is about to turn lower and it is time to consider pricing new-crop deliveries, although this move could be little more than a healthy pause in a continued uptrend.
Wednesday's move resulted in a bearish outside bar created on the daily chart, trading both higher and lower than Tuesday's range only to end the session lower. This move does not fit the definition of a key reversal, which requires a daily open that is above the previous day's close, while today's market opened at Tuesday's close of 626.30/mt. A reliable signal of a change in direction would also be accompanied by higher volume trade, while today's November volume was down 35% from the previous day and down 28% from the previous four-day average.
While not shown, noncommercial traders have been aggressively liquidating their long positions in canola, with March 2 CFTC data showing the noncommercial net-long futures position falling for a third straight week and for the ninth time in 10 weeks to 22,581 contracts, the smallest bullish position held in 27 weeks or since early September. The weakest long position holders have exited the canola market while it is hard to imagine significant selling to follow at a time when fundamentals remain bullish.
P[L1] D[0x0] M[300x250] OOP[F] ADUNIT[] T[]
The blue line on the first study shows the new-crop Nov21/Jan22 futures spread. This spread has weakened $0.50/mt so far this week to minus $3.30/mt, the weakest spread seen this calendar year, with the January contract trading over the November. This signals a growing bearish view of fundamentals held, although this spread is calculated at roughly 25% of full commercial carry, which continues to be viewed as bullish overall.
It is interesting to note that on this date during the past five years, this new-crop futures spread ranged from minus $4/mt to minus $6.60/mt, averaging minus $5.42/mt. This is not significantly different from the current spread, while the March AAFC supply and demand tables were forecasting new-crop ending stocks ranging from 1.1 million metric tons to 3.3 mmt over this five-year period. In comparison, AAFC is currently forecasting 2021-22 stocks to remain unchanged at a very tight 700,000 mt or 3.5% of use, despite a 4% increase in seeded acres and a 1 mmt or 4.7% decrease in forecast demand (crush plus exports).
One signal of ample demand in new crop positions is the current Canadian Canola Board Margin Index, which is currently showing a return of $61.56/mt against the old-crop May contracts, while reported over $150/mt in new-crop positions.
Futures will likely have to do some heavy lifting in order to encourage new-crop selling after prices currently being realized in old-crop delivery months.
Cliff Jamieson can be reached at cliff.jamieson@dtn.com
Follow him on Twitter @Cliff Jamieson
(c) Copyright 2021 DTN, LLC. All rights reserved.


Comments
To comment, please Log In or Join our Community .