Canada Markets
A Look Back to the May 2008 Canola Contract
The March 2021 canola contract rose $43.10/metric ton this week to close at $773.50/mt, reaching a high of $780.90/mt. This move took out the $754.30/mt high reached on March 3, 2008 to reach an all-time high, not only for a front-month contract, but for any contract in history.
At the same time, the March trade may poorly reflect what's happening in the market, with open interest reported at only 9,439 contracts as of Feb. 18 and shorts scrambling to get out. Turning to the continuous active chart, which reflects the higher activity seen in the May contract, we see the nearby May contract gain $34.50/mt over the week to close at $735.50/mt. The continuous active chart shows chart resistance remaining at $769.90/mt, a high also reached on March 3, 2008 for the May 2008 contract.
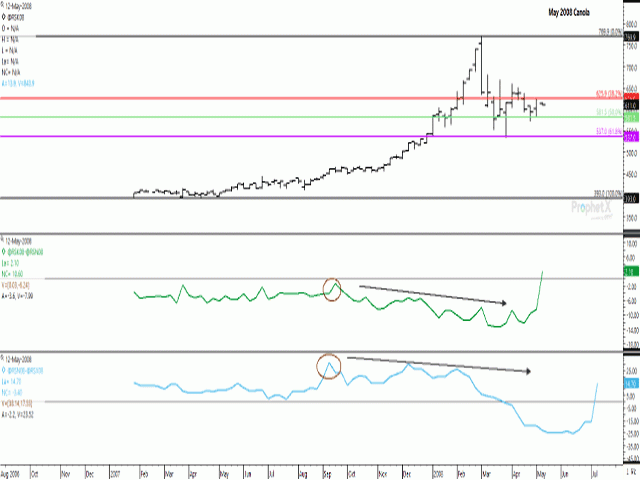
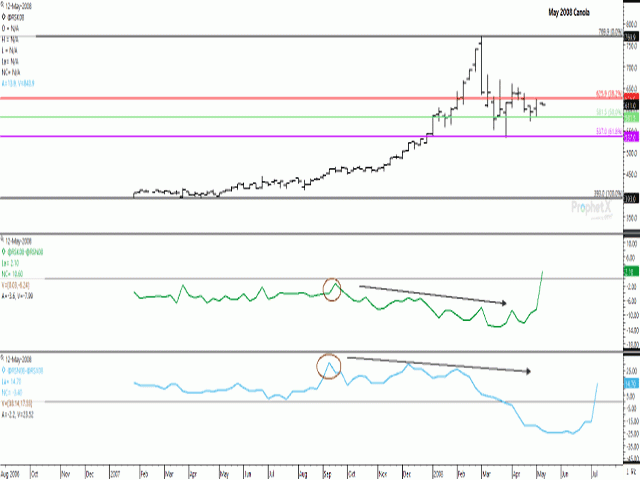
The attached chart is the May 2008 chart, which shows a trend reversal taking place in the week of March 3, 2008, when the May contract reached a high of $769.90/mt, only to free-fall by $101/mt over the same week to close at $639/mt. This is a great example of what can go wrong in a market.
P[L1] D[0x0] M[300x250] OOP[F] ADUNIT[] T[]
While CFTC data was not compiled for canola during this period, a March 20, 2008 Producer.com piece points to a "fund froth" that moved prices well-above reasonable levels.
It is interesting to see on the attached chart (green line, first study) that the May 2008/July 2008 futures spread reached its strongest or narrowest point in the week of Sept. 17, 2007 at minus $1.30/mt (July trading over the May), failing to reach inverted territory while weakening from this point into the following April. The same can be said for the old-crop/new-crop spread, or the July/November spread, as seen in the lower study. It would seem that there was an uneasiness in the market at the time given that spreads started weakening almost six months prior to the peak in the market.
Compare this to the current May/July inverse of $31.80/mt and the July/November inverse of $114.20/mt. Things are different this time.
A glance at fundamental data also fails to justify the move higher seen in 2008. At 11.6 mmt, crop-year supplies were up 3.2% from the previous year, while disappearance is reported at roughly 10 mmt. Ending stocks of 1.4615 mmt were down 321,000 mt from the previous crop year but still higher than the previous five-year average of 1.376 mmt. Stocks/use is calculated at 14.5% for 2007-08, which is in no way comparable to the 3.3% calculated for 2020-21, which could be even lower when the dust settles.
Also supportive for today's market is a bullish forecast for the year ahead. The early outlook from AAFC indicates that Canada's canola stocks will fall to 700,000 mt in 2020-21 or 3.3% of use, while forecast to remain steady at 700,000 mt in 2021-22. The USDA has forecast soybean production to rise by 9.4% in 2021 due to a hike in acres and increasing yields, although ending stocks are to remain tight at 3.2% of use. As well, the USDA also shows a forecast drop in soybean oil stocks for a second year to 1,614 million pounds in 2021-22. This will be the lowest stocks in eight years, while the average price is left unchanged from 2020-21 at 40 cents/lb USD.
While predicting how long this rally will last is dangerous, today's close on the May 2021 contract remains $34.40/mt below the May 2008 high and this bears watching.
Cliff Jamieson can be reached at cliff.jamieson@dtn.com
Follow him on Twitter @CliffJamieson
(c) Copyright 2021 DTN, LLC. All rights reserved.


Comments
To comment, please Log In or Join our Community .