Canada Markets
SRW Fails to Breakout Higher
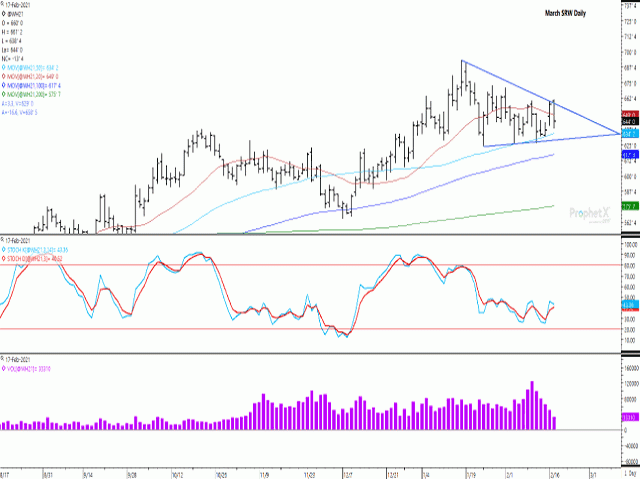
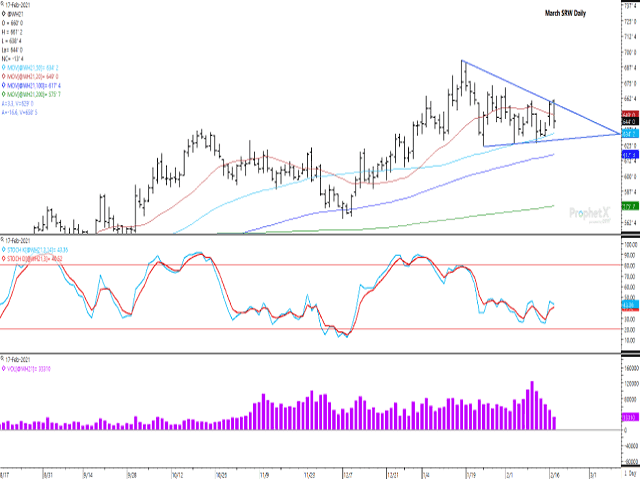
As seen on the attached chart, the most active March Chicago soft red winter wheat contract reached a 10-day high in Wednesday's trade, poking above the resistance line drawn from the Jan. 15 high, only to reverse course and give up roughly two-thirds of Tuesday's gain. The contract's move on Feb. 17 saw a return to close below the contract's 20-day moving average (brown line), while the session's activity also reflects a bearish outside-day trading bar on the daily chart.
For the past month, all three wheat markets have consolidated in a bullish pennant pattern, as shown by the converging blue lines on the chart. This pattern is viewed as bullish in a sense that it follows a rapid move higher, which started from the Dec. 7 low on this particular chart, while it is most commonly followed by a breakout from the chart pattern in the same direction of the trend on higher volume.
P[L1] D[0x0] M[300x250] OOP[F] ADUNIT[] T[]
As indicated in John J. Murphy's Technical Analysis of the Futures Markets, this pattern is "among the most reliable of continuation patterns and only rarely produce a trend reversal."
The measuring implications for this pattern are significant, with prices to continue in the direction of the trend upon breaking out by an amount equal to the length of the flag-pole, or the distance travelled prior to the start of the pattern. In this particular case, price moved from a $5.65 1/2-per-bushel (bu) low on Dec. 7 to a $6.93/bu high on Jan. 15, or a move of $1.27 1/2. A breakout today at $6.58 1/2/bu on the resistance line would suggest a potential move to $7.86/bu, or the highest trade in more than eight years on the continuous active chart.
At the same time, this time could be different. Feb. 17 trade resulted in a bearish outside bar formed on the daily chart, along with a failure to sustain a move above the contract's 20-day moving average. The first study shows that momentum indicators have faced difficulty sustaining upward momentum and have remained in the lower one-half of the neutral zone on the chart. The lower study shows daily volume falling for five consecutive sessions and no sign of the increasing volume that accompanies the upside breakout.
Cliff Jamieson can be reached at cliff.jamieson@dtn.com
Follow him on Twitter @CliffJamieson
(c) Copyright 2021 DTN, LLC. All rights reserved.


Comments
To comment, please Log In or Join our Community .