Canada Markets
November Canola testing Resistance
Feb. 11 trade saw the new-crop November canola contract close higher for the third time out of the four sessions this week, while printing a bullish outside bar on the November daily chart. The November closed up a modest $0.20/metric ton, at $564.80/mt, after reaching a $568.30/mt high on Thursday. Trade did, however, fall short of testing the $568.90/mt contract high reached earlier this week.
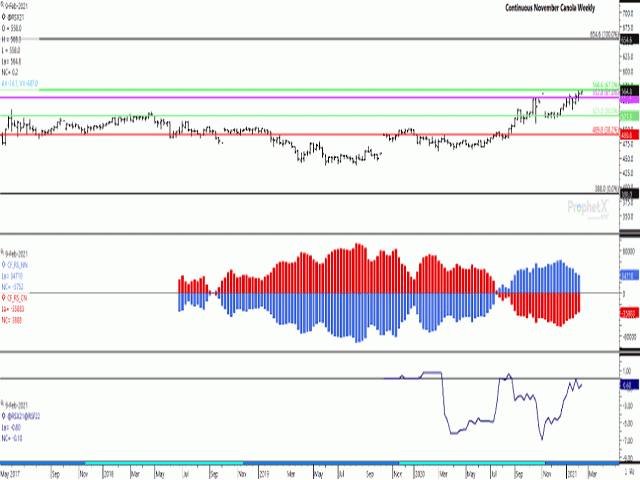
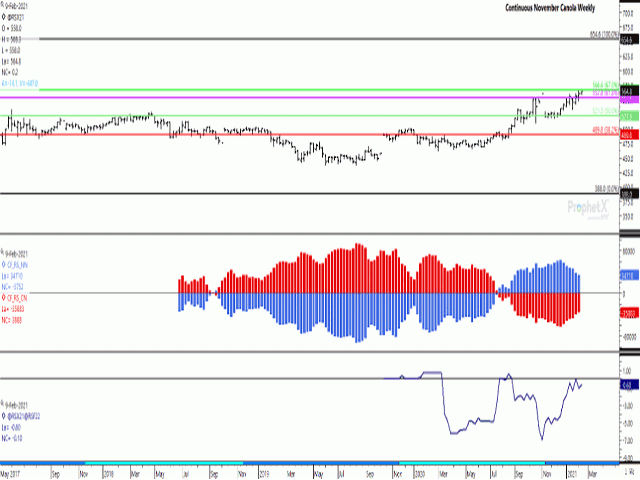
The attached chart is the longer-term continuous November chart, which shows the current November trade on the verge of a breakout higher that could lead to further upside.
P[L1] D[0x0] M[300x250] OOP[F] ADUNIT[] T[]
The upper horizontal green line at $566.60/mt is the 67% retracement of the move from the $654.60/mt high reached in September 2012 to the September 2014 low of $388/mt. The November price has moved above this resistance in four of the past five sessions, with one daily close above this level on Feb. 9, although a weekly close above this resistance will require a further surge in Feb. 12 trade.
A move above this level could face resistance from weekly highs from 2012 and 2013 at $577.20/mt to $577.60/mt, then again at $626/mt. These are the only two obstacles preventing a continued move to the $654.60/mt last reached in July 2012.
The first study shows noncommercial traders (blue histogram bars) reducing their bullish net-long position for six straight weeks as of the most recent Feb. 2 data. We will be watching for Friday's CFTC data release for a possible reversal in this recent trend.
The lower study shows the new-crop Nov21/Jan22 futures spread at modest carry of $0.60/mt (January contract trading over the November). This spread weakened by $0.10/mt on Feb. 11 but can still be viewed as a bullish spread overall and well-below full commercial carry. This bears watching.
Cliff Jamieson can be reached at cliff.jamieson@dtn.com
Follow Cliff Jamieson on Twitter @CliffJamieson
(c) Copyright 2021 DTN, LLC. All rights reserved.


Comments
To comment, please Log In or Join our Community .