Canada Markets
Statistics Canada's Dec. 31 Stocks Report
The latest in a series of Statistics Canada's crop reporting is the Feb. 5 release of Canada's Dec. 31 2020 grain stocks. While stocks reports are perhaps not followed as close as other reports, this one is of particular interest due to the significant pace of global and domestic demand faced over the first five months of this crop year. Canola data is expected to gain a great deal of attention, with concerns of the need to ration stocks being discussed for the past few months.
Statistics Canada summarizes today's report noting that despite increased production of most principal field crops in 2020, stocks of most crops fell year-over-year, with only durum, corn, oat and rye stocks estimated to increase from December 2019 to December 2020.
Total stocks of the principal field crops fell by 5.5 million metric tons year-over-year to 65.968 mmt, which is the smallest stocks in five years with a year-over-year decline seen in Canada's largest crops of wheat and canola.
Canada's all-wheat stocks were reported at 24.845 mmt, the first year-over-year drop in five years and below the average trade guess of 25.4 mmt as seen in DTN's Thursday commentary. This is a 3.9% drop from 2019 and is still 2.8% higher than the five-year average. As indicated by Statistics Canada, this drop is despite record producer deliveries of 14.4 mmt over the first five months, up 15.9% from the previous crop year.
When wheat (excluding durum) is considered, stocks were reported at 20.082 mmt, the first drop in five years. This volume is down 5.2% from 2019 although remains 5.1% higher than the five-year average. Based on current estimates of supply, this implies a record implied demand of 12.671 mmt during the first five months. In 2019-20, January-through-July demand led to total disappearance of 16.4 mmt, a pace that would imply ending stocks of 3.7 mmt, below the current AAFC estimate of 5.3 mmt. In order to understand the current pace of exports, Statistics Canada's December merchandise trade report was also released today to add December data, showing August-through-December exports at 8.765 mmt, up 31% from the same period last crop year.
Durum stocks were reported at 4.763 mmt as of Dec. 31, up 2.2% from last year while 6% below the five-year average. Based on estimated supplies, this implies the largest demand seen in four years. In 2019-20, durum disappearance totaled 3.924 mmt from January through July, a pace of demand that would lead to ending stocks of 839,000 mt, below the current AAFC estimate of 950,000 mt but still higher than realized in 2019-20. When we look at the current pace of movement through December, exports are reported at a pace that is 21% higher than seen in 2019-20.
P[L1] D[0x0] M[300x250] OOP[F] ADUNIT[] T[]
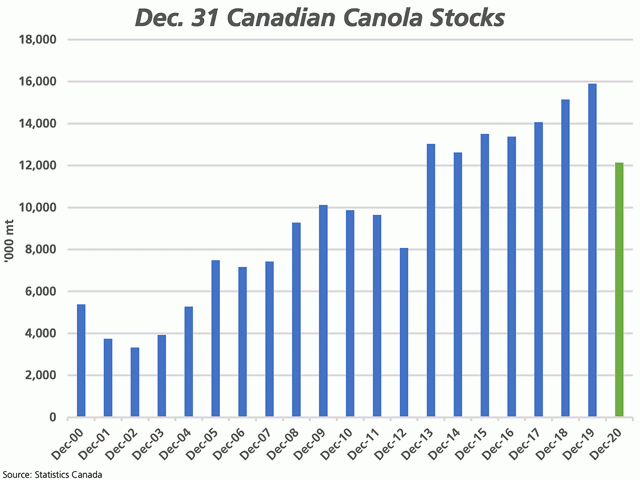
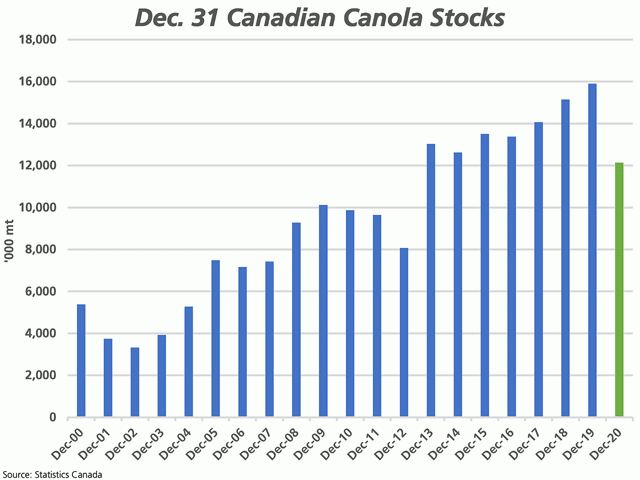
Canola stocks were reported at 12.140 mmt, below the 12.3 mmt average trade guess and the lowest in eight years. This was a historic drop of 3.767 mmt or 23.7% from 2019 to 2020.
To put this into context, this 3.767 mmt drop from one year to the next is larger than the Dec. 31 stocks were reported at on Dec. 2002, as seen on the attached chart. In 2019-20, canola disappearance totaled 12.776 mmt, a volume higher than the current Dec. 31 level of stocks, while the current pace of exports and domestic disappearance is running at a pace that is ahead of the previous crop year.
With the addition of Statistics Canada's Dec. data today, low erucic acid canola exports over the first five months of the crop year are pegged at roughly 5.160 mmt, up 50.7% from last year.
Serious rationing will be needed soon given this estimate, while ending stocks are poised to fall well-below the 1.2 mmt forecast by AAFC. At the time of writing, nearby canola futures are trading mixed in buy-the-rumor-sell-the-fact trading.
Stocks of barley were reported at 5.680 mmt, down 4.6% from last year and 2.3% lower than the five-year average, despite larger 2020 production. When current estimated supplies are considered for 2020-21, this implies the largest demand faced in at least 20 years, with Chinese export demand the largest factor. In 2019-20, disappearance over the January-through-July period is reported at 5 mmt, which implies ending stocks of roughly 680,000 mt on July 31 2021, which is below the current AAFC estimate of 1 mmt and the 957,000 mt carried out of 2019-20.
Oat stocks were reported at 2.682 mmt, up 0.4% from Dec. 2019 and 3.4% higher than the five-year average. A pace of demand matching 2019-20 would lead to July 31 stocks that are below the 600,000 mt AAFC forecast and in line with the 426,000 mt carried out of 2019-20.
Dry pea stocks are reported at 2.565 mmt, down 3.6% from last year and 2.2% below the five-year average. AAFC has been forecasting stocks to increase to 450,000 mt in 2020-21, although it is more likely that they remain closer to the 233,000 mt carried out of 2019-20.
Lentil stocks were reported at 1.848 mmt, down 23.2% from Dec. 31 2019 and 5% below the five-year average. This is the lowest December stocks reported in four years. To put this volume into perspective, Canada exported 2.2 mmt in the January-through-July period in 2019-20 which suggests we will be sweeping bin bottoms in the months to come.
Soybean stocks were reported at 3.688 mmt as of Dec. 31, down 9% from 2019 and 6.1% below the five-year average, the lowest December stocks in four years. Today's data release points to September-through-December exports of 2.811 mmt, up 43% from last year while despite a return of China for significant volumes. Even an average pace of movement over the balance of the crop year will lead to ending stocks well-below the current 600,000 mt estimate released by AAFC.
Corn stocks for Dec. 31 were reported at 11.055 mmt, up 3.3% from last year and 4.2% below the five-year average. This is the first increase seen in three years. The average pace of January-through-August disappearance would indicate that ending stocks could fall below the current 2.3 mmt estimate.
Cliff Jamieson can be reached at cliff.jamieson@dtn.com
Follow him on Twitter @CliffJamieson
(c) Copyright 2021 DTN, LLC. All rights reserved.


Comments
To comment, please Log In or Join our Community .