Canada Markets
A Look at Recent Market Losses by Commodity
Despite heavy selling and losses realized in the grains on Jan. 22, the jury is out on whether we are experiencing a move towards a change in trend in the grains or if we are seeing a normal correction within the current uptrend.
One unofficial Twitter poll today asks producers where they think markets are going in the next few weeks, with the latest results showing that 18.2% think that grains will continue lower, 32.2% think markets will slow down and move sideways, 39.2% think that grains will bounce higher again and 10.5% answered mixed -- depends which grain. Opinions vary widely among respondents, as can be expected, while it is these varying opinions needed for a market to function.
There is currently no right or wrong answer, but one interesting quote from famous investor Warren Buffett said, "Be fearful when others are greedy. Be greedy when others are fearful."
P[L1] D[0x0] M[300x250] OOP[F] ADUNIT[] T[]
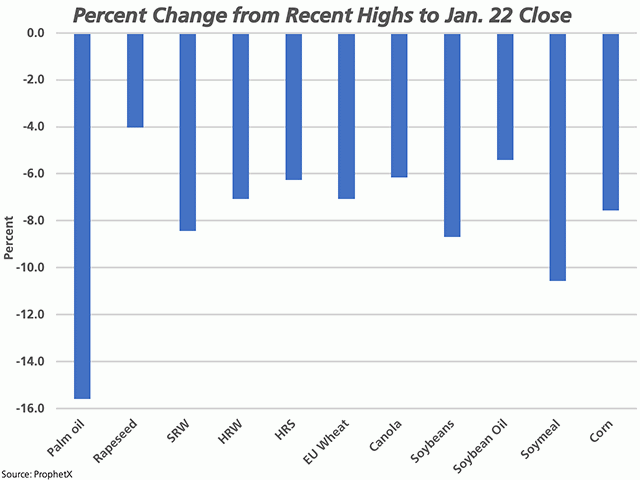
One commonly used definition of a market correction is a loss in excess of 10%, while some definitions are expanded to indicate a loss in excess of 10% but less than 20%.
Looking across the attached chart, only palm oil (measured in local Malaysian currency) and soymeal have realized losses in excess of 10% since reaching their recent highs. As of the Jan. 22 close, palm oil is down 15.6% and soymeal is down 10.6%.
Facing the largest correction, this week's crude palm oil in Malaysia dipped below the uptrend line drawn from a May 2020 low on the continuous active weekly chart, while bounced to close above this support line to finish near the middle of the week's trading range. When fundamentals are taken into account, the market remains torn between weak January export data and an expected drop in production ahead.
If we look at the individual charts for these grains and products, we see that the weekly charts for corn, soft red winter wheat and hard red winter wheat saw trade over the week hold within the range of the previous week's range, a sign of sideways trade overall as traders pause and take stock of recent developments. The charts for spring wheat also came close to consolidating trade, although spring wheat did reach a high this week that was 1/4 cent above last week's high.
Another factor that bears consideration is weekly volume reported across the grains. The weekly volume reported by ProphetX in the nearby March contracts for soybean oil, corn, spring wheat and hard red winter wheat were the lowest reported in three weeks. Weekly volume for March soft red winter was down from the previous week. This data seems inconsistent with a 180-degree change in sentiment.
While picking market tops is close to impossible and not advised, further signs may be needed to signal that the uptrend in some of these grains is over.
Cliff Jamieson can be reached at cliff.jamieson@dtn.com
Follow him on Twitter @CliffJamieson
(c) Copyright 2021 DTN, LLC. All rights reserved.


Comments
To comment, please Log In or Join our Community .