Canada Markets
A Look at the Largest Global Wheat Exporters
The USDA's December World Agricultural Supply and Demand Estimates (WASDE) report included an upward revision in global production and consumption of wheat, while resulting in a lower revision in global ending stocks, a surprise based on Dow Jones pre-report estimates. At 316.5 million metric tons, global ending stocks were estimated below the range of the pre-report estimates, shown to range from 318.5 mmt to 325.5 mmt, while the average was reported at 321.5 mmt, or 1 mmt higher than last month's USDA estimate. While this forecast showed the most favorable move this month when compared to both global soybean and corn balance sheets, stocks are to remain at a record high.
This month, the export forecast was increased by 270,000 metric tons for the United States, by 1 mmt for both Australia and Canada, by 500,000 mt for Russia and by 20,000 mt for Kazakhstan, while looking at the world's major exporters.
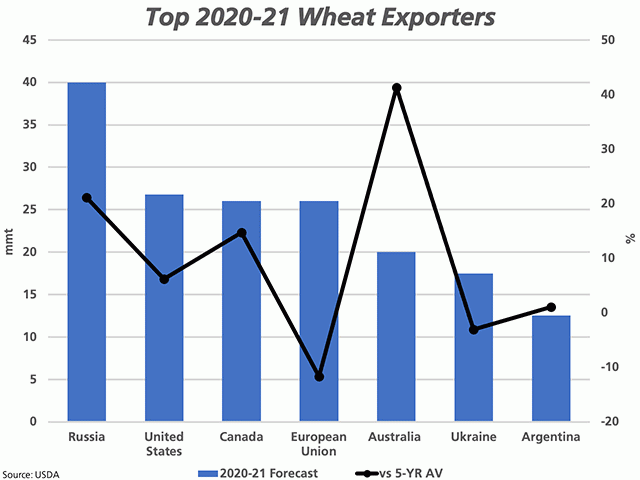
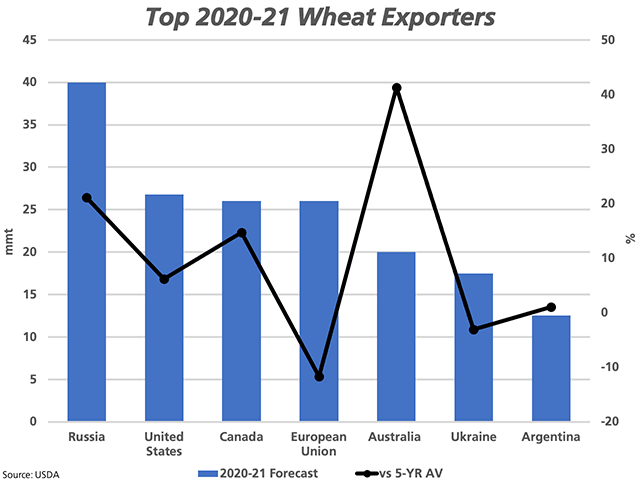
As seen on the attached chart, Russia remains at the top of the global exporters with a forecast of 40 mmt (blue bar measured against the primary vertical axis), while this volume is 21.1% above its five-year average exports (black line with markers against the secondary vertical axis).
P[L1] D[0x0] M[300x250] OOP[F] ADUNIT[] T[]
What is interesting is the competition for second place, with the U.S. forecast to export 26.81 mmt, which compares to 26 mmt for both Canada and the European Union.
Focusing on the forecast for Canada, the forecast volume is above Agriculture and Agri-Food Canada's 24.760 mmt all-wheat (wheat plus durum) estimate released in November, although Statistics Canada has since increased its forecast for all-wheat production by just over 1 mmt. If realized, the 26 mmt would be a record and would be 15.6% higher than the five-year average of 23.5 mmt, or 14.7% higher than the USDA estimates, as shown on the chart.
Are we on track to hit this volume? As of week 18, or the week ending Dec. 6, licensed exports of wheat total 7.0177 mmt and licensed exports of durum total 1.9532 mmt, or 8.971 mmt in total. Week 18 marks the first 35% of the crop year, while this pace projects forward to 25.6 mmt of licensed exports, not including unlicensed exports and the export of flour.
An even more bullish projection is calculated when one considers the seasonality of shipments; during the past five years, an average of 32.5% of total wheat exports was reported in the weekly Canadian Grain Commission data as of week 18, while an average of 29.2% of total durum exports are recorded in licensed exports as of week 18. This average pace projects forward to all wheat exports of 28.2 mmt, a volume that would prove out of reach due to a lack of supplies.
Cliff Jamieson can be reached at cliff.jamieson@dtn.com
Follow him on Twitter @CliffJamieson
(c) Copyright 2020 DTN, LLC. All rights reserved.


Comments
To comment, please Log In or Join our Community .