Canada Markets
Canadian Grain Commission Data as of Week 9
We can only hope that the Canadian Grain Commission's cumulative data as of week 9, representing the first 17.3% of the crop year's shipping weeks, is a sign of what is to come for the balance of the crop year.
A number of factors have collided to allow early success. CN Rail has referred to the strong offshore demand as pandemic buying, with China notably a significant buyer of ag commodities on a global scale. Prospects of an above-average prairie production, an early prairie harvest, a high quality harvest, a price rally through harvest, less competition for rail service and the addition of terminal space on the West Coast are just some of the factors that have come together to kick the system into high gear.
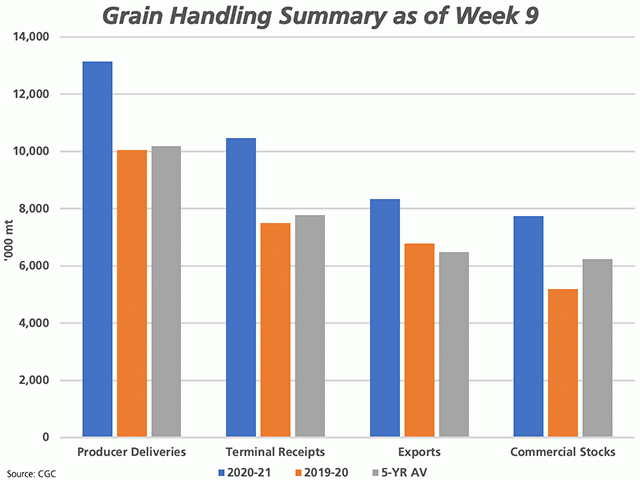
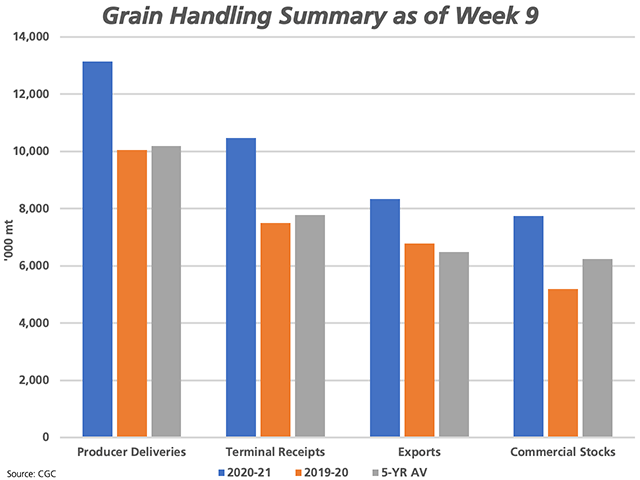
As seen on the attached chart, producers have delivered 13.152 million metric tons of all grains into licensed facilities in the first nine weeks, or the week-ending Oct. 4. This volume is up 30.9% from the same period in 2019-20 and 29% above the five-year average. While the year-over-year deliveries of most major crops are higher this fall, what jumps out is a 1.266 mmt increase in canola deliveries as of week 9 and the next largest is a 454,700 mt increase in bulk lentil deliveries.
Given this surge in deliveries, space in the country is at a premium. Week 9 Canadian Grain Commission data shows primary elevator inventories at 4.782 mmt, which represents 91.8% of the estimated working capacity utilized by Quorum Corporation for its Weekly Performance Update. This ranges from 88.2% of Manitoba's working capacity utilized, to 97.3% of the working capacity in Alberta filled.
Receipts at all export terminals are shown at 10.4681 mmt, up 39.6% from last year and 34.7% higher than the five-year average. Both CN and CP achieved record movement in the third quarter of 2020, indicating lower competition from movement of competing commodities as well as the increased use of high capacity cars. CP Rail states that its 8,500-foot trains carry 40% more product than their regular 7,000-foot trains. Despite the good performance, the AG Transport Coalition, a group that moves 90% of the Prairies grain, reports unfulfilled demand of 5,065 hopper cars as of week 8, of which 2,424 hopper cars or close to 50% has been cancelled outright by CN Rail.
P[L1] D[0x0] M[300x250] OOP[F] ADUNIT[] T[]
Terminal exports as of week 9 are 23% higher than one year ago and 28.7% higher than the five-year average. When year-over-year data is considered, wheat movement (excluding durum) is up 969,800 metric tons or 34.9% from last year, while canola exports are 569,200 mt or 43.4% ahead of last year. One disappointing statistic is durum exports, which are down 372,900 mt, or 43.3%, from last year although there may be little reason for concern.
One sign of the strength of our export program is the movement of wheat. In week 9, Canada exported 529,600 mt of wheat (excluding durum), the largest weekly volume shipped so far this crop year. Of the nine shipping weeks, this is the third week where more than 500,000 mt has been shipped in a single week. This compares to just four weeks in 2019-20 when volume exceeded 500,000 mt, two weeks in 2018-19 and one week in 2017-18.
It is unlikely that buyers will fill space on the hope that it will move, which is why I believe growing commercial stocks is a favourable signal of pending movement. As seen on the attached chart, commercial stocks of all major crops at 7.750 mmt is 49.5% higher than this time last year and 24.1% higher than the five-year average. By commodity, commercial stocks of wheat are close to normal, down 1.5% from average, while stocks of durum are 36.9% higher than average, oats are 81.3% higher than average, barley at 75.7% higher than average, canola at 42.9% higher, peas at 30.3% higher and bulk lentils at 46.5% higher.
Lastly, the growing vessel list for the West Coast, reported at 43 vessels for week 9 which is the highest weekly count reported this crop year, remains a favourable signal.
**
DTN 360 Poll
This week's poll asks what you think will be the toughest challenge faced this crop year? This poll can be found at the lower-right side of your DTN Canada Home Page. We welcome and thank you for sharing your opinion.
To our Canadian customers -- have a Happy Thanksgiving weekend!
Cliff Jamieson can be reached at cliff.jamieson@dtn.com
Follow him on Twitter @Cliff Jamieson
(c) Copyright 2020 DTN, LLC. All rights reserved.


Comments
To comment, please Log In or Join our Community .