Canada Markets
Alberta Ag Releases First Dryland Yield Estimates
Alberta Agriculture's biweekly crop condition estimates as of July 28 show conditions remaining steady, with the good-to-excellent rating for all crops in the province shown at 77.5%, down 0.1 point from the mid-month assessment. This assessment is up from the 67.8% reported this time last year and the five-year average of 60.9%.
Looking across a number of major crops, the spring wheat estimate increased 1.3 points to 81.6% G/E over the past two weeks, the durum rating fell 0.8 point to 88.3 G/E, canola fell 0.4 point to 71.6% G/E and peas fell 1 point to 76.7% G/E.
Condition ratings for major crops are higher than the five-year average for this week. For example, the spring wheat condition is 18.6 points higher than average, the durum rating is 47.8 points higher than average, canola is 10.1 points higher and peas are 14.9 points higher.
P[L1] D[0x0] M[300x250] OOP[F] ADUNIT[] T[]
By region, crop condition could be viewed as an inverse of what was seen a year ago. During the same week last year, crops in the Southern Region were rated at 51% G/E, while the Northeast Region was rated at 84.6% G/E. This week, the Southern Region is rated at 87.7% G/E, slightly better in the Central Region at 92.5% G/E while the Northwest Region is rated at 35.4%. The rating for the Southern Region is 38.4 points above average for this week, while the Northwest Region's rating is 23.3 points below average, with the Peace also 2.9 points below average.
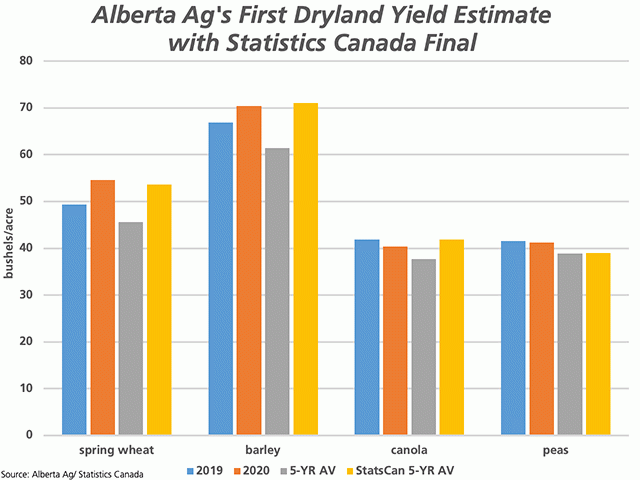
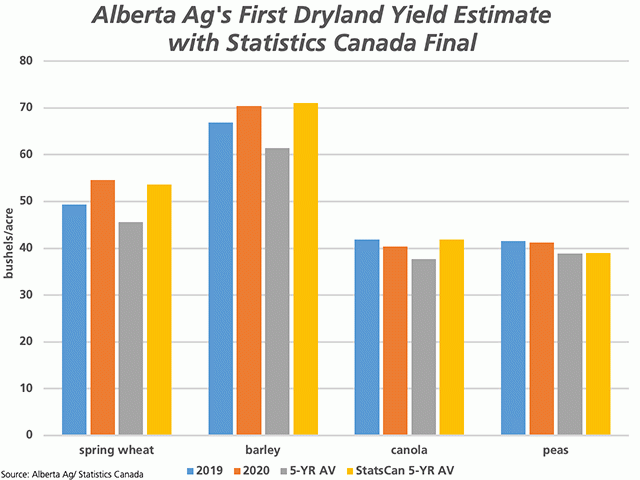
The attached chart shows the province's first dryland yield assessment for 2020 (brown bars), with spring wheat at 54.6 bushels/acre, barley at 70.4 bpa, canola at 40.4 bpa and peas at 41.2 bpa. While spring wheat and barley are estimated higher than the same week in 2019 (blue bars), both canola and dry peas are estimated slightly lower.
It is interesting to note that, on average over the past five years, the official Statistics Canada final estimate (yellow bars) are 8.1 bpa higher than Alberta Agriculture's first dryland estimate for wheat, 9.6 bpa higher for barley, 4.2 bpa higher for canola and 0.1 bpa higher for peas.
DTN 360 Poll
This week's poll looks at readers' comfort level with the various crop condition assessments released by the government for their particular area. You can weigh in with your thoughts in this poll, which is found at the lower-right of your DTN homepage.
Cliff Jamieson can be reached at cliff.jamieson@dtn.com
Follow him on Twitter @Cliff Jamieson
© (c) Copyright 2020 DTN, LLC. All rights reserved.


Comments
To comment, please Log In or Join our Community .