

Canada Markets
Ontario Cash Corn Price Below Average
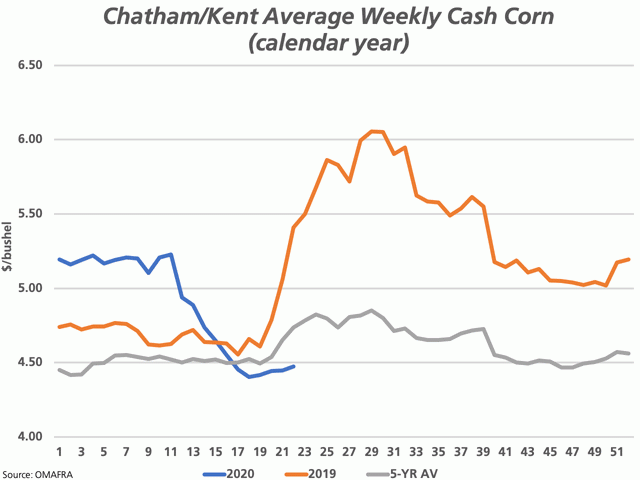
The cash corn price reported by Ontario Ministry of Agriculture, Food and Rural Affairs (OMAFRA) as of week 22 of the calendar year (reported monthly), shows price below average at a time when DTN analysis points to the potential for a seasonal high in the front-month contract in the near future.
DTN's seasonal analysis indicates that the nearby corn future tends to trade higher from early October to early June, although the effects of the COVID-19 pandemic may see the seasonal high come later than normal. This week's trade has seen the nearby July contract fail to test the previous week's high, after realizing the first lower weekly close in three weeks in last week's trade.
In addition to pandemic's effects on the market, traders may be extra-sensitive to news as it pertains to the crop's potential. The most recent CFTC Commitment of Traders report shows noncommercial traders increasing their bearish net-short position in corn for the 11th time in 12 weeks. They now hold a fresh record net-short futures position of 235,103 contracts, as of June 9.
P[L1] D[0x0] M[300x250] OOP[F] ADUNIT[] T[]
On June 15, cash bids reported by DTN for Ontario ranged from $4.59/bushel to $4.79/bu. delivered into elevators, while transfer elevators ranged as high as $5.09 to $5.28/bu.
Comparing these prices to week 26 data shown on the chart, it is likely that prices continue to remain below average levels for this time of year.
OMAFRA data shows the cash price reached a high in week 29 in 2019, while highs have ranged from week 21 to week 29 over the past five years. The average of the five years would suggest an annual high in week 26, or late June, the mid-point of the year, with the grey line on the chart pointing to the potential for a modest bump higher in prices. The highs reached over the past five years ranged from $4.61/bu. in 2017 to a high of $6.05/bu. in 2019. The average annual high calculated over the past five years is $5.10/bu., while OMAFRA reported the 10-year average price of $5.32/bu. for week 29 as the highest average monthly price for the year.
**
DTN 360 Poll
This week's poll asks which crop you are most comfortable storing and carrying into the next crop year. Feel free to share your thoughts on this week's poll, found on the lower-right side of the DTN Canada site.
liff Jamieson can be reached at cliff.jamieson@dtn.com
Follow Cliff Jamieson on Twitter @Cliff Jamieson
© (c) Copyright 2020 DTN, LLC. All rights reserved.
Comments
To comment, please Log In or Join our Community .