Canada Markets
Prairie CWRS Nearing a Crop-Year High
DTN Lead Analyst Todd Hultman recently released a piece titled "Spring Wheat's Bullish Potential," pointing to the notion that spring wheat futures may have fallen into a bearish trap.
Spring wheat planting in the United States was estimated by USDA at 42% complete as of Sunday, May 10, well behind the five-year average of 63%. The largest-producing state, North Dakota, is estimated at 27% complete, the lowest of the six states followed and below the five-year average of 56% complete. More delays may lie ahead given the precipitation forecast over the next seven days.
As a result, Todd points out that speculators, or noncommercial traders, are sitting on a significantly large net-short futures position of spring wheat. As of May 5 CFTC data, noncommercial traders had increased the size of their bearish net-short position for a third straight week to 19,854 contracts, which is the largest net-short position seen in data going back to 1992.
Meanwhile, commercial traders increased their bullish net-long position for a third straight week to 16,032 contracts as of May 5, the largest bullish position held since the week of Sept. 17. The size of this position has grown by 353% over three short weeks.
P[L1] D[0x0] M[300x250] OOP[F] ADUNIT[] T[]
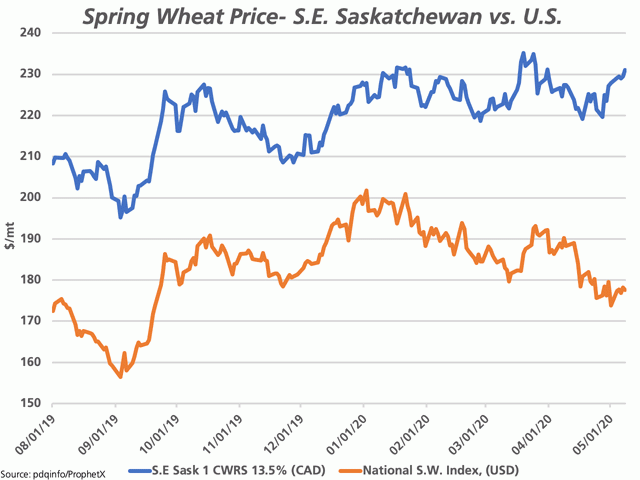
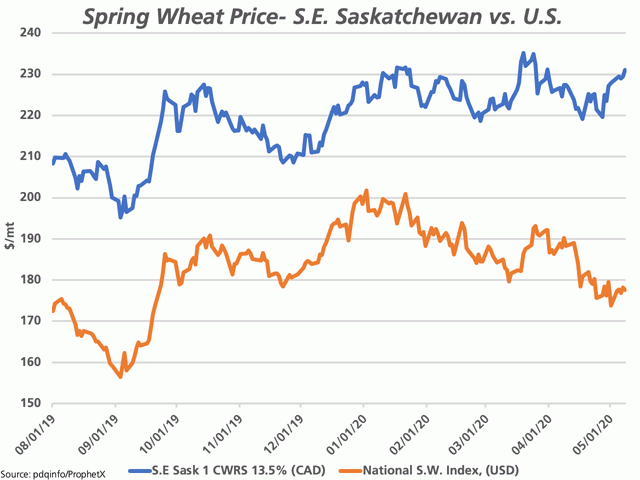
DTN reports the weekly close for the July contract for the week ended May 8 at the 9th percentile of the five-year range for this date, which could lead one to wonder how much more downside is possible. As well, Todd points out that DTN's National Spring Wheat Index of $4.83 per bushel ($177.47 per metric ton USD) on May 8 is well below the $5.90/bu USD cost of producing spring wheat in the Northern Plains of the U.S, as estimated by USDA.
It is interesting to note that this analysis and focus on a potential catalyst to spark this market comes at a time when spring wheat is already showing signs of cash market strength on the Canadian prairies, as shown by the Canadian dollar trend in the No. 1 CWRS 13.5% bid for southeastern Saskatchewan, one of nine regions reported by pdqinfo.ca (blue line).
Since reaching a crop-year high of $235.20 per metric ton (mt) CAD on March 19, a low of $219.12/mt was reached on April 17, and 74% of this loss has been retraced for a close of $231.04/mt on May 8. Another $2.05/mt was added on May 11 for a close at $233.09/mt, just $2.11/mt or $0.06/bu shy of testing the crop-year high.
A look at the longer-term cash price chart for this region of the prairies shows the current price on the verge of testing the 67% retracement of the move from the December 2018 high to September 2019 low at $236.19/mt, while the next chart resistance lies at $244.10/mt.
DTN 360 POLL
This week's DTN 360 Poll asks what you think will be the most likely revision we will see in the seeded-acre estimates released by Statistics Canada due to the challenges faced in surveying for the March Intentions report? This poll is found at the lower-right of your DTN Canada Home Page. We thank you for sharing your opinions!
Cliff Jamieson can be reached at cliff.jamieson@dtn.com
Follow him on Twitter @Cliff Jamieson
© (c) Copyright 2020 DTN, LLC. All rights reserved.


Comments
To comment, please Log In or Join our Community .