

Fundamentally Speaking
USDA Corn Yield Revisions

In its first field based crop production report, USDA pegged the 2018 U.S. corn yield at 178.4 bushels per acre (bpa).
This is not only the highest August yield estimate ever made by USDA, topping the August 2016 projection of 175.1 bpa, but is above the highest final yield estimate, topping the final 2017 record yield of 176.6 bpa.
Now the debate can start about whether this year's initial yield forecast will increase given ideas that "big crops get bigger', or will that 178.4 bpa projection be the highest of the year?
Some feel that the advanced state of the crop in terms of the percent of the plants first silking, then in the dough stage and now in the dent stage is so accelerated relative to past years that the crop is maturing too fast at the expense of final yields.
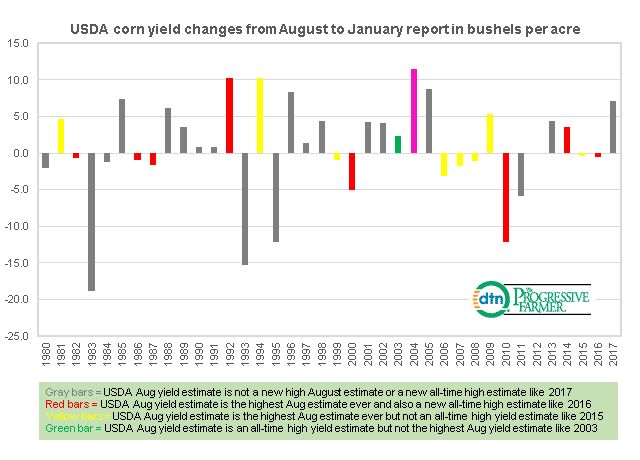
This chart shows the USDA national corn yield changes from the August report to the final report given in January in bpa.
P[L1] D[0x0] M[300x250] OOP[F] ADUNIT[] T[]
The gray bars represent years where USDA August yield estimate is not a new high August estimate or a new all-time high estimate like 2017.
The red bars represent when USDA August yield estimate is both the highest August estimate ever and also a new all-time high estimate like 2016.
The yellow bars represent where the USDA August yield estimate is the highest ever August estimate but not an all-time high yield estimate like 2015.
Finally, the green bar is when USDA's August yield estimate is an all-time high yield estimate but not the highest August yield estimate.
The only one of those was in 2003 when the August corn yield estimate came in at 139.9 bpa which, though above the final record yield established back in 1994 of 138.6 bpa, was below the August 2000 yield projection of 141.9 bpa.
In looking at the data from 1980 to 2017, the average change for those 38 years was an improvement from the August estimate to the final report in January of 0.8 bpa.
Of the 38 years, 17 times the yield fell from the August estimate to the final by an average of 4.9 bpa, it increased 20 times by an average of 5.5 bpa and one year, actually the drought season of 2012 the August yield was put at 123.4 bpa and that turned out to be the final yield that season.
For a year such as this where the initial August yield estimate is both the highest August ever and a new all-time high projection (which are the red bars), this has happened nine times with an average yield revision of up 0.5 bpa with the USDA actually seeing the final yield lower six times by an average of 3.5 bpa, while the three times the final yield is higher than what is already projected as a record the yield has increased by an average of 10.2 bpa.
For the yellow bars where USDA August yield estimate is the highest August estimate ever but not an all-time high yield estimate, this has happened eight times with an average yield increase of 1.6 bpa with downward revisions seen five of those years by an average of 1.4 bpa, with three years the yield rising by an average of 6.7 bpa.
Finally in 2003 which was the only year USDA's August yield projection was above the prior record final year figure but lower than the highest August estimate final yields, that season rose by 2.3 bpa.
(BAS)
© Copyright 2018 DTN/The Progressive Farmer. All rights reserved.
Comments
To comment, please Log In or Join our Community .