

Fundamentally Speaking
Subsoil Moisture Appears Sufficient for Top Corn, Bean States

Corn and soybean futures have gotten whacked over the past two weeks losing 30-35 cents as fears of a global trade war adversely impacting U.S. export sales of each commodity has turned the charts lower triggering some fund long liquidation.
We also note that weather conditions so far for the most part are quite favorable as evidenced by the fact that soybeans have the best initial crop ratings and corn the second highest ratings since the USDA introduced national crop condition reports in 1986.
Though there has been some concern over the early arrival of some serious heat and whether this will presage a summer of above average temperatures in the Corn Belt, these elevated readings along with decent moisture has created "greenhouse" like conditions.
This week it appears that the main forecasting models are coalescing around a notable increase in rainfall over the next two weeks, especially in some of the drier regions.
This already has market pundits talking about the potential of record U.S. corn and soybean yields.
P[L1] D[0x0] M[300x250] OOP[F] ADUNIT[] T[]
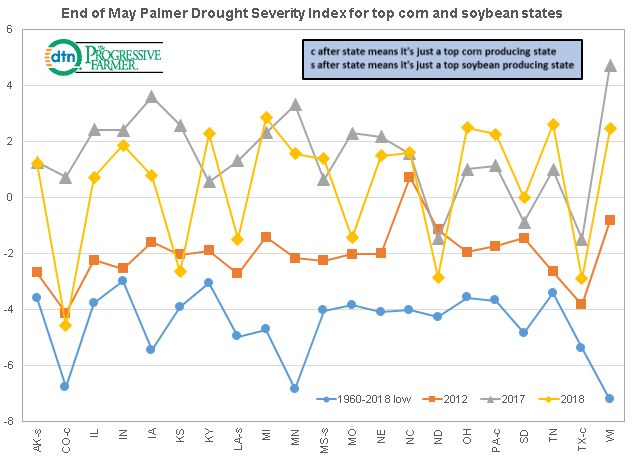
Along these lines we decided to look at the end of May Palmer Drought Severity Index (PDSI) readings for the top corn and soybean states with 15 states in both categories and three each just being one of the top 18 corn or soybean states.
As noted before in prior posts, the PDSI is the monthly value that is generated indicating the severity of a wet or dry spell.
This index is based on the principles of a balance between moisture supply and demand.
The index generally ranges from -6 to +6, with negative values denoting dry spells and positive values indicating wet spells. There are a few values in the magnitude of +7 or -7.
PDSI values 0 to -.5 =normal; -0.5 to -1.0 = incipient drought; -1.0 to -2.0 = mild drought; -2.0 to -3.0 = moderate drought; -3.0 to -4.0 = severe drought; and greater than -4.0 = extreme drought.
Similar adjectives are attached to positive values of wet spells.
We plot the lowest or worst drought readings for the period 1960-2018, the 2012 end of May reading which was the most recent severe drought and the end of May readings for both this year and last.
The High Plains states where dry conditions are pervasive show the most severe PDSI readings including Co, KS, ND and TX.
The only Midwest state in the list is MO as most of the key Midwest corn and soybean growing states have readings above zero and are well above levels seen the last severe drought year of 2012.
This suggests that most of the top states are in decent shape heading into the most critical parts of the growing season.
(KA)
© Copyright 2018 DTN/The Progressive Farmer. All rights reserved.
Comments
To comment, please Log In or Join our Community .