

Fundamentally Speaking
10, 25 and 40-year Soybean Yield Trends
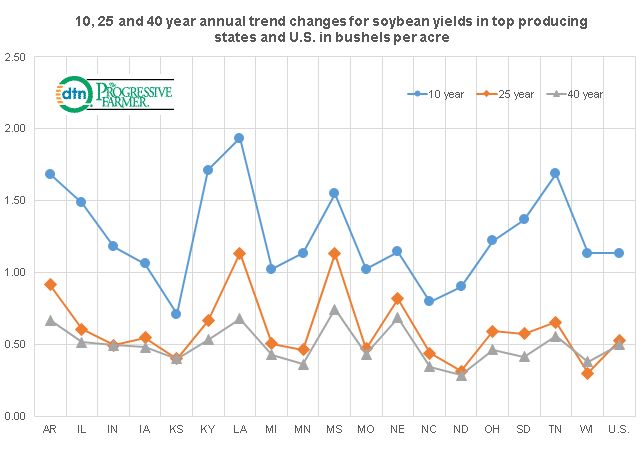
Similar to a piece done earlier, this graphic shows the ten, 25 and 40 year annual trend changes for soybean yields in the top 18 producing states and the U.S. as these figures are the slopes of the linear regression line for each of those time periods.
Until this year, the U.S. has set national soybean yield records for three seasons in a row, though this year's projected 49.5 bushel per acre (bpa) yield is still the second highest ever next to the year ago 52.0 bpa figure.
P[L1] D[0x0] M[300x250] OOP[F] ADUNIT[] T[]
To attain a new U.S. yield peak a number of the top 18 producing states also have to have record yields and we certainly have seen that since 2014.
Note that soybean planted acreage is more geographically dispersed than corn with seedings extending well into the Delta and Southeast and yields there are fast approaching those seen in the more traditional Midwest states.
In fact, over the past ten years, soybean yields have increased at a rate of 1.50 bushels per acre per year in Arkansas, Kentucky, Louisiana, Mississippi and Tennessee, the only states to do so.
These states along with Nebraska are also the ones that have achieved the best yield gains over the 40-year time span while almost all states and the U.S. exhibit the usual pattern of having the 10-year annual yield increase above the-25 year increase which is higher than the 40-year increase with the exception of Wisconsin.
A final observation s that soybean production has increased tremendously in the Dakotas over the past decade especially in but this appears mostly linked to rising acreage especially in North Dakota as that state along with North Carolina are the only ones to see soybean yields fail to increase even at a 1.0 bpa rate per year since 2008.
(KA)
© Copyright 2018 DTN/The Progressive Farmer. All rights reserved.

Comments
To comment, please Log In or Join our Community .