

Technically Speaking
NCI: Cash Corn's Moving Averages

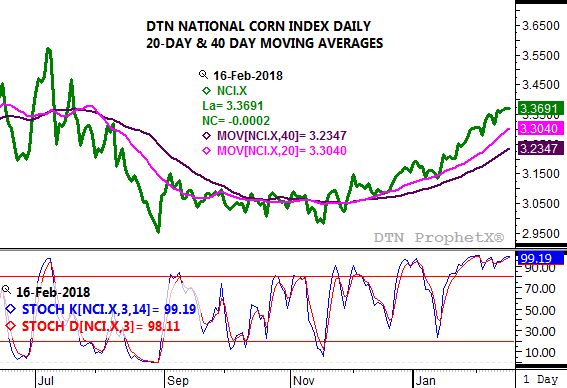
The DTN National Corn Index (NCI, national average cash price) has been in a solid minor (short-term) uptrend on its daily chart since posting a low of $2.95 1/4 on August 30, 2017. This led to a long period of consolidation, with the NCI holding below $3.15 through late December. However, on December 8 the faster 20-day moving average (pink line) crossed above the slower 40-day moving average, establishing a bullish technical signal that ushered in the ongoing move that saw the NCI finish last week near $3.37.
Recall my simple definition of trend (price direction over time) and my first rule of markets (Don't get crossways with the trend). In order to follow Rule #1, besides just giving any market the eyeball test, it helps to know momentum. Moving averages are a simple way of gauging momentum, reflecting average daily (in this case) closes over different periods of time. What a technical analyst is looking for as far as signals go is a single crossover of the slower average by the faster average, or a double crossover including the market being studied itself.
P[L1] D[0x0] M[300x250] OOP[F] ADUNIT[] T[]
Let's take a closer look at the NCI on December 8. That day, the NCI was calculated at $3.1164, up $0.0144 from the previous day's calculation. After a long period of near equal moving averages, the 20-day was calculated at $3.0672 with the 40-day at $3.0642. Not only was this a single-crossover (20-day over 40-day) but a double-crossover as well since the NCI was higher than both moving averages.
This signaled that cash corn had moved into a minor uptrend, a signal that would be confirmed on December 26 when the NCI was calculated at $3.1536, above the $3.1508 high from September 6. Given the previous sideways range of $0.1989, this bullish breakout above the previous high set the upside target at roughly $3.35.
Recall that last week saw the NCI finish near $3.37, slightly above its expected high given the previous sideways range of about 20 cents. This could be a warning that cash corn may have overshot a bit, and could come under pressure. But are there other warning signals out there as well?
Look at the bottom study, daily stochastics. Note that these two momentum lines came in at 99.19% and 98.11% respectively, indicating the NCI is sharply overbought at this time. While markets can stay overbought (or oversold) for long stretches, the fact daily stochastics are this near 100% could be a concern.
Looking at its weekly close-only chart, the NCI is in a secondary (intermediate-term) uptrend as well. However, it is testing projected resistance at $3.3683 while weekly stochastics are above 95%, also in position for a possible bearish crossover.
To track my thoughts on the markets throughout the day, follow me on Twitter:www.twitter.com\Darin Newsom
Comments
To comment, please Log In or Join our Community .