

Technically Speaking
Nov Beans Bullish - Again

I know, this is starting to sound like a broken record but soybeans posted bullish short-term technical signals on daily charts last Friday. This was followed by more buying enthusiasm overnight into Tuesday morning. And yes, I know I've talked about bullish soybeans before. Many times, with the market failing to follow-through.
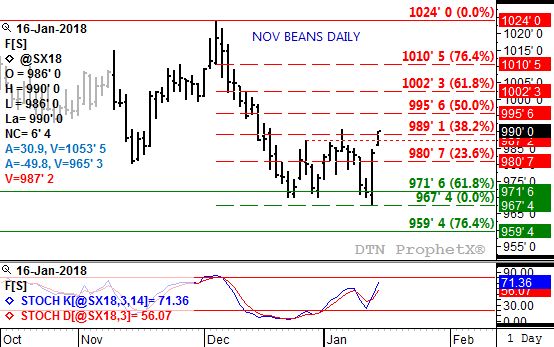
Take a look at the accompanying chart, the daily chart for new-crop November soybeans, and a clear pattern jumps out at you. After falling to a new low of $9.67 1/2 last Friday the contract was able to rally, so much so that it easily eclipsed Thursday's high of $9.75 3/4 before closing 12 cents higher for the day. Those of you familiar with this blog will recognize this as a key reversal, and since it occurred on a short-term daily chart I'll call it a "minor key reversal". Minor, secondary, or major the implication is the same: Whatever time frame's trend we are looking at just changed, from a technical point of view.
In this case we are indeed talking about Nov beans' minor (short-term) trend. Note the previous downtrend began with the high of $10.24 on December 5. For most of the month the move was down, with few higher daily closes to be seen. Through late December and early January the contract started to consolidate at or above the previous set of lows at $9.70. Note that this price was hit four separate times (Dec 21, Dec 22, Dec 29, and Jan 11) before last Friday's initial sell-off.
Friday's subsequent rally was followed by a three-day weekend, allowing bullish momentum to build to the point that the Nov bean open of $9.86 Monday night left what looks to be a breakaway price gap confirming the minor uptrend is gaining strength. Overnight trade saw the contract post a high of $9.90, fractions below the previous spike to $9.90 3/4 and a test of retracement resistance near $9.89. Indications are that the Nov beans should be able to extend this uptrend to next resistance at $9.95 1/2 over the coming days, and possibly as high as $10.02 1/4.
Much will depend on the contract's daily stochastics (bottom study). Note that this technical indicator signaled a move to an uptrend with a series of bullish crossovers below the oversold level of 20% during the late December/early January time period. Now I'll be watching how fast it climbs above the overbought level of 80% to set the stage for bearish crossovers signaling the minor uptrend is nearing its end.
To track my thoughts on the markets throughout the day, follow me on Twitter:www.twitter.com\Darin Newsom
P[L1] D[0x0] M[300x250] OOP[F] ADUNIT[] T[]
Comments
To comment, please Log In or Join our Community .