
Technically Speaking
Monthly Analysis: Livestock Markets

Live Cattle: The December contract closed at $100.125, down $6.45 on the monthly chart. December live cattle followed up the bearish outside month posted in August with consistent pressure during September. This led to a new major (long-term) low of $99.375 and an extended downtrend. However, monthly stochastics are in single-digits signaling a sharply oversold situation. This leaves open the possibility of a spike reversal at some point.
P[L1] D[0x0] M[300x250] OOP[F] ADUNIT[] T[]
Feeder Cattle: The November contract closed at $119.65, down $18.70 on the monthly chart. The market posted another new major (long-term) low of $119.425 in September. Once again, this could possibly be a Wave C low. The September close was below support at $123.275, a price that marks the 76.4% retracement level of the previous uptrend from $85.45 (December 2008) through the high of $236.175 (September 2014).
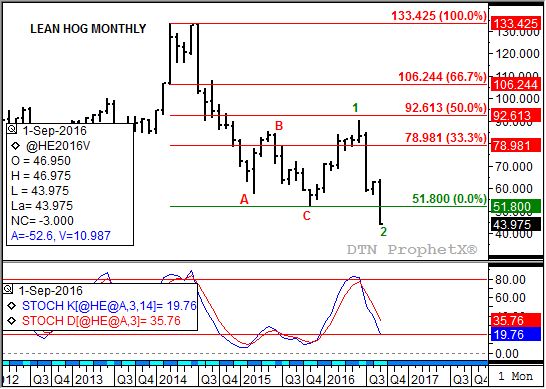
Lean Hogs: The December contract closed at $43.975, down $18.875 on the monthly chart. The collapse during September broke up the market's 5-wave uptrend as the month's potential Wave 2 low of $43.975 was well below the previous Wave C bottom of $51.80. While the market could see a reversal at any time, monthly stochastics (long-term) momentum remain bearish.
Corn (Cash): The DTN National Corn Index (NCI.X, national average cash price) closed at $2.95 1/4, up 22 1/4 cents for the month. It could still be argued that the major trend is sideways between support at the combined lows of $2.8147 (October 2014) and $2.7302 (August 2016), and resistance between the peaks of $4.05 3/4 (July 2015) and $4.00 1/2 (June 2016). Monthly stochastics are nearing a bullish crossover below the oversold level of 20%.
Soybean meal: The more active December contract closed at $299.60, down $7.10 on the continuous monthly chart. Despite the continued sell-off the market remains in a major (long-term) 5-Wave uptrend. Dec meal closed near support at $299.90, a price that marks the 76.4% retracement level of Wave 1 from $258.90 (February 2016) through the peak of $432.50 (June 2016). Wave 2 normally tends to retrace most of Wave 1.
To track my thoughts on the markets throughout the day, follow me on Twitter: www.twitter.com\DarinNewsom


Comments
To comment, please Log In or Join our Community .