
Technically Speaking
How Bullish Are Beans?
If you've been paying attention to your DTN system, and I'm sure you have, you know just how exciting the ongoing rally in the soybean market has been. A look at the Top-10 Most Read list in DTN News shows four titles specifically mentioning soybeans and three others that discuss action in the market. Not to mention my On the Market column from Friday, "The Beans of Summer", for DTN subscribers only (can be found on DTN Pro in News/Town Hall (or AgNews), or My DTN News/Columns (or Ag News)). Yes, soybeans have everyone's attention these days; and that could prove to be the market's catalyst, or its curse.
Take a look at the attached chart that illustrates the structure of the soybean futures market. Recall that every market has a structure, and every structure has two sides. The investment side of the market tends to set the trend of the futures market and is reflected in the activity of noncommercial traders.
P[L1] D[0x0] M[300x250] OOP[F] ADUNIT[] T[]
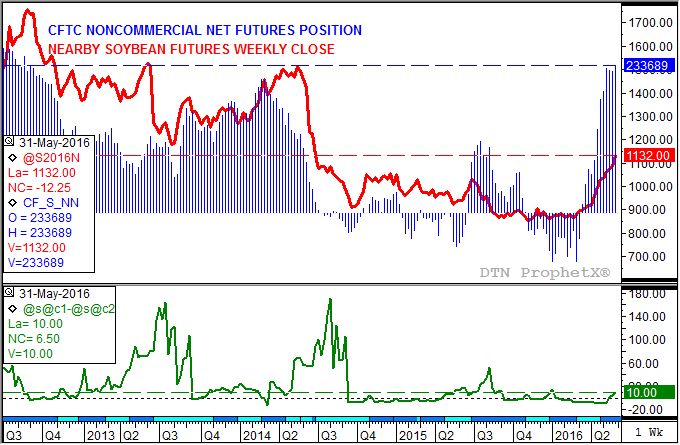
Using weekly CFTC Commitments of Traders data (top chart, blue histogram) we see this group has been actively adding to their net-long futures position since mid-March. Since covering their net-short position of 42,292 contracts (week of March 8), the net-long position reportedly grew to 233,689 contracts this past week (through Tuesday, May 31). This is the largest noncommercial net-long futures position since the 249,104 contracts reported back in late August 2012 (blue dashed line). Given the strength of this buying it is not surprising that the weekly close of the futures market (top chart, red line) has rallied from $8.63 1/2 (week of February 22, 2016) to this week's settlement (July contract) of $11.32, the highest weekly close since $11.33 1/2 the week of June 30, 2014 (dashed red line).
While noncommercial buying could continue, particularly if the U.S. dollar index has rejoined its major (long-term) downtrend, investment led rallies tend to destabilize unless supported by commercial interest. Again as most of you know, I look at the commercial side's view of supply and demand by using futures spreads (price difference between futures contracts). For this continuous chart, I'm using the spot spread (bottom study, green line) which is simply the nearby futures contract minus the first deferred.
If you look at the bottom study, you see that commercial traders have only recently moved to the bullish side of the soybean boat. The weekly close chart shows that in early May the spot spread was trading at a carry of 10 cents (the deferred contract held a 10 cent premium to the nearby contract), reflecting a then neutral view of supply and demand by commercial interests. However, as May came to an end and June got under way the spot spread had rallied to an inverse (the nearby contract was is higher priced than the first deferred contract) of 10 cents. This put the spot spread at its highest weekly close since the 14 1/4 cent inverse the week of January 4, 2016.
With both sides now in sync, the soybean market should continue to extend its uptrend. As discussed in the recent blog post "Monthly Analysis: Grain Markets" (June 1), the next major price target on the continuous monthly chart is $11.58 3/4. Beyond that, trendline resistance is in the low $12 range.
How will we know if the rally in soybeans is starting to run out of gas? The first sign is often a change of heart by commercial traders. Last Friday's close saw a round of commercial selling weaken the inverse in the July-to-August futures spread, bringing it in at the previously mentioned weekly close of 10 cents. If this spread continues to struggle to get through the previous high (14 1/4-cent inverse), the uptrend in the futures market could start to stall. It should also be noted that the cash soybean market (the DTN National Soybean Index, or national average cash price) tends to rally into July before succumbing to seasonal pressure. But that's a blog for a different day.
To track my thoughts on the markets throughout the day, follow me on Twitter: www.twitter.com\DarinNewsom

Comments
To comment, please Log In or Join our Community .