


Market Matters Blog
Futures Spreads and Basis Levels Tell a Lot About a Market
Editor's Note: This article is updated from when it originally appeared in the August issue of Progressive Farmer.
**
Perhaps the most challenging aspect of working within the grain markets is choosing which indicators to rely on to guide decision-making. At DTN, the primary goal of our Six Factors strategies is to simplify a market's drivers into manageable, yet powerful, tools to allow for timely and confident marketing decisions. One factor monitored is the "Commercial Outlook," which includes grain basis and futures spreads -- two significant components that are often overlooked as clear indicators of a market's true underlying conditions.
Whether it be USDA reports, technical (chart)-based signals or seasonal patterns, all are valuable tools at a marketer's disposal. However, one key advantage to the incorporation of cash-market-driven indicators such as spreads and basis is that it helps filter out the short- to medium-term "noise" present in futures alone.
Specifically, while headline algorithms and outside influence may be driving price direction and masking the underlying fundamental (supply and demand) situation, basis and spread action will often capture true market dynamics that producers and traders experience in local cash markets throughout the country.
P[L1] D[0x0] M[300x250] OOP[F] ADUNIT[] T[]
This is part of the reason why it is common to see basis firm through rapid futures price drops and vice versa. The local cash prices, which facilitate the flow of grain from suppliers to users, are much slower to respond to short-term, fast-changing news.
Take the corn market in 2026 as an example. Although most active corn futures rallied from the low $4s in October 2025 to a high of $4.87 1/2 in early May 2026, the national average corn basis over this same period ranked consistently among the weakest of the past decade. As for spreads, the difference between the July and December 2026 corn futures contracts hit its narrowest point of the year during the second week of January and has been steadily building carry into the market ever since.
Both indicators point to plenty of corn supply relative to demand and suggested the corn rally had an impending expiration date long before futures eventually topped out in early May.
Next, let's apply the same study to the upcoming new crop 2026 season, with the benefit of recent cuts to yield forecasts by USDA as well as private analysts (DTN included). The December 2026 to March 2026 futures spread is currently paying 15 3/4 cents of carry, which still ranks as the third weakest of the past decade for mid-August, despite the aforementioned production concerns. This suggests a fairly comfortable supply of corn is still anticipated to be available to the market through the balance of 2026. This is evidenced by the basis as well, with the DTN national average currently 50 cents under the December board and the second weakest of the past decade for mid-August. However, it's worth noting that the spread is narrower (less carry) in 2026 as compared to 2025, and broadening the market's carry structure to next summer does paint a picture of higher uncertainty for corn supplies relative to demand by late in the 2026-27 marketing year.
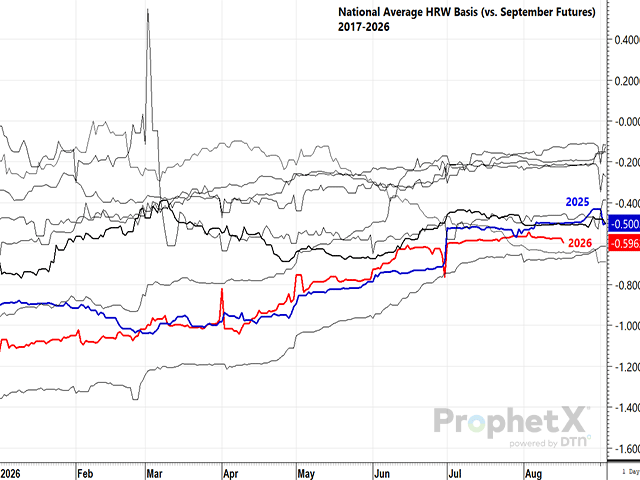
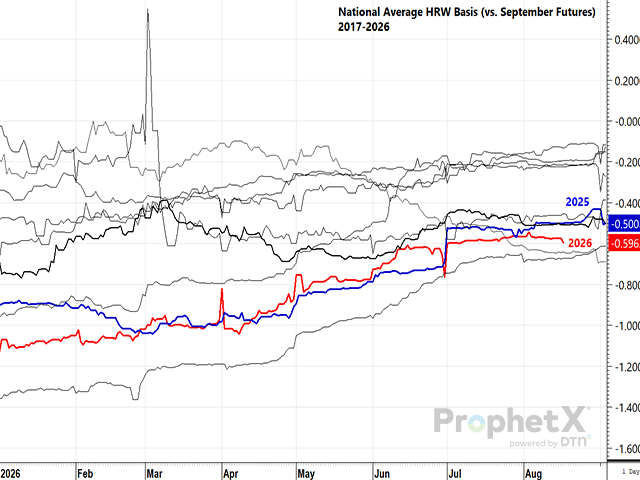
Another market that will be fascinating to apply these observations to is Kansas City wheat. In terms of spread action, the carry between July and September contracts has contracted from almost 12 cents in late May to under a nickel in mid-June. This comes as the market begins to incentivize front-month deliveries amid the early stages of what is expected to be the smallest U.S. winter wheat harvest in more than 60 years. Average basis for hard red wheat, meanwhile, remains the third weakest of the past decade, although the trend will be worth monitoring in the weeks and months immediately following harvest.
Revisiting this in mid-August shows the Kansas City September to December spread recently narrowing (removing carry) to 13 cents between the contracts, very close to surpassing 2021 as the fourth highest over the past decade for mid-August.
Expanding the study over the September to May hard red wheat contracts yields a similar result. Recent years which featured less market carry were years such as 2022-23, when U.S. wheat stocks fell to their lowest level in 15 years. Whereas, even with a 56-year low in production, 2025-26 wheat stocks are expected to be a three-year low. DTN's national hard red wheat basis remains ranked as the third weakest of the past decade for mid-August, suggesting the market is still feeling the weight of the 920 million bushels of wheat stocks carried into the new crop year which began back on June 1.
No single market factor can tell the whole story. However, viewing the market through multiple lenses -- such as the Commercial Outlook above combined with seasonal tendencies -- goes a long way toward establishing a realistic price range given current market conditions, as well as identifying the timing of selling opportunities that offer the greatest potential to improve the bottom line.
Rhett Montgomery can be reached at rhett.montgomery@dtn.com
Follow him on social platform X @R_D_Montgomery
(c) Copyright 2026 DTN, LLC. All rights reserved.


Comments
To comment, please Log In or Join our Community .