Fundamentally Speaking
September WASDE vs Small Grains Summary
Friday the USDA will release the small grains summary which will detail U.S. wheat production by class, and also the quarterly on and off farm grain stocks report for corn, soybeans and wheat.
Often wheat gets most of the attention as this is the final production report of the year and weighs heavily on what the September 1 wheat stocks figure is.
For corn and soybeans, earlier this month in the September WASDE report the USDA projected U.S. corn ending stocks as of Sep 1, 2023, at 1.452 billion bushels (bb) and that for soybeans at 250 million bushels (mb).
P[L1] D[0x0] M[300x250] OOP[F] ADUNIT[] T[]
We are seeing trade estimates for this Friday's stocks report close to those figures at 1.439 bb for corn in a range from 1.320 to 1.506 bb and the average for soybeans at 245 mb in a range from 216 to 285 mb.
These average trade guesses are barely changed from the Sep 2023 USDA WASDE projections.
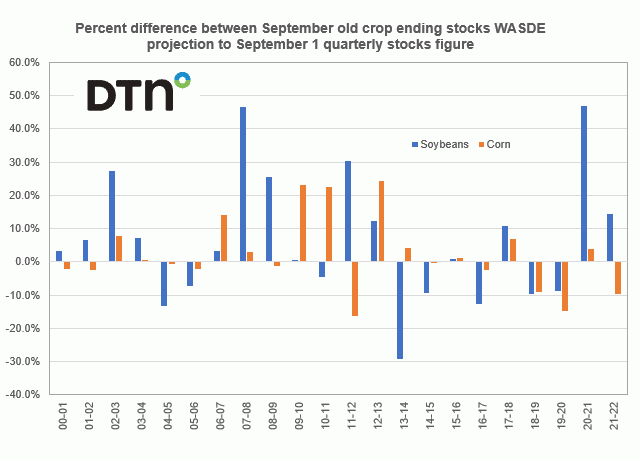
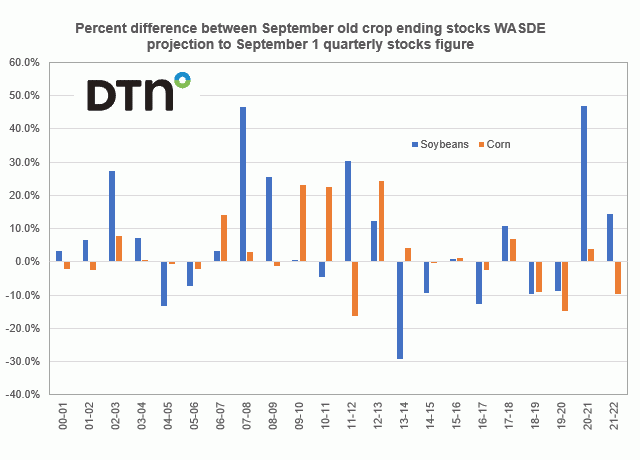
There have been some years where the differences are exceptionally large, such as two years ago when the 9/1/2021 quarterly bean stocks estimate of 257 mb was about 47% higher than the September 2021 WASDE pegged ending stocks at 175 mb.
There was also a jump of that magnitude in soybeans back in the 2007/08 season.
Often these differences are linked to a revision in production of the prior year's crop.
Such was the case in the 2020/21 season when USDA revised old crop (2020/21) soybean acreage, production, and yield estimates higher and a similar situation was seen in the 2007/08 season.
Hence, even though the trade is looking for little change in the September 1 quarterly stock figures from what USDA indicated two weeks ago, there is precedence for some surprises.
(c) Copyright 2023 DTN, LLC. All rights reserved.


Comments
To comment, please Log In or Join our Community .