

Fundamentally Speaking
U.S. Winter Wheat Crop Conditions

In prior posts we have noted the woeful shape that the 2023 U.S. winter wheat crop is in with crop ratings essentially at their lowest levels ever for this time of year.
Seeing quite a bit written about the situation in Kansas which is the largest winter wheat producing state as the latest U.S. Drought Monitor map shows 81% of the state in some form of drought with over 43% in the worst category, which is exceptional drought.
No wonder then that the latest crop ratings show 33% of the state's crop in very poor condition with 28% rated poor with a mere 13% of the state's winter wheat crop rated in the top two categories which are good or excellent.
The U.S. winter wheat crop is comprised of hard red winter wheat (HRW) grown mostly in the Southern and Central Plains, soft red winter wheat (SRW) sown in areas of the Delta and Midwest and white winter wheat (WW) grown mostly in the upper Midwest and Pacific Northwest.
P[L1] D[0x0] M[300x250] OOP[F] ADUNIT[] T[]
Hard red winter wheat constitutes the largest proportion of the U.S. winter wheat crop and it is here where crop conditions are particularly abysmal.
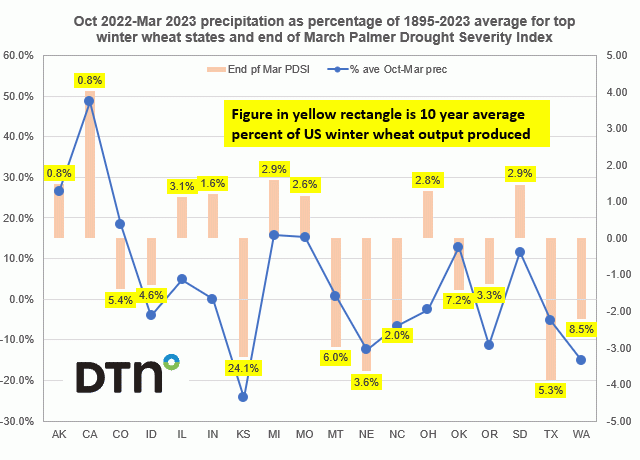
This graphic shows the Oct 2022-Mar 2023 precipitation as percentage of 1895-2023 average for top winter wheat states and end of March Palmer Drought Severity Index.
Some winter wheat producing states have had copious amounts of precipitation over the past six months, none more so than California where its 27.31 inches is a massive 48.6% above the 1895-2022 average of 18.4 inches, and the second highest since 1999 as its end of March Palmer Drought Severity Index has jumped to 4.02 from -0.70 just the month prior.
AK, IL, IN, MI, MO, and OH also have had good precipitation since October and have PDSI readings showing normal or even slightly wet soil conditions.
The problem is these are not some of the larger winter wheat producing states, certainly not of the HRW variety as shown by the figures in the yellow rectangles which the is 10-year average percent of U.S. winter wheat output produced in that state.
Here that crop is in big trouble as the largest producer (Kansas) where its 5.67 inches of precipitation is a massive 24.2% below the 1895-2022 average of 7.48 inches, resulting in a PDSI figure of -3.26 as much of the state in the extreme or exceptional drought categories.
This is no small consideration given it is by far the largest winter wheat producing state accounting for over 24% of national output.
Nebraska is in a similar situation where the past six months of precipitation is 12.4% below average with an even worse PDSI reading of -3.63 and TX is 5.2% below average precipitation with a PDSI reading of -3.87.
We should also note that two other large producing states of WA and MT are also seeing dry conditions over the past few months along with low PDSI ratings.
(c) Copyright 2023 DTN, LLC. All rights reserved.
Comments
To comment, please Log In or Join our Community .