Fundamentally Speaking
Drought, Dryness Hurting 2023 Winter Wheat Yields
When looking at the USDA November 2022 crop production briefing, we were struck by the fact that only two of the top 18 corn states, IL and WI, had record yields and were two of just four to have yields above the 2021 levels which also included MN and ND.
Similarly for soybeans, just two states had record yields this past season, AK and MS, as they along again with MN and SD are only four of top 18 states to have yields above the year ago levels.
Keep in mind it's not tough to beat corn and bean yields in MN and ND given they had disastrous results in 2021 due to a devastating drought, and to be truthful, yield results in 2021 on the whole were just okay, essentially at trend, so this implies growing conditions for many of the country's top corn and bean states this year are well below par.
P[L1] D[0x0] M[300x250] OOP[F] ADUNIT[] T[]
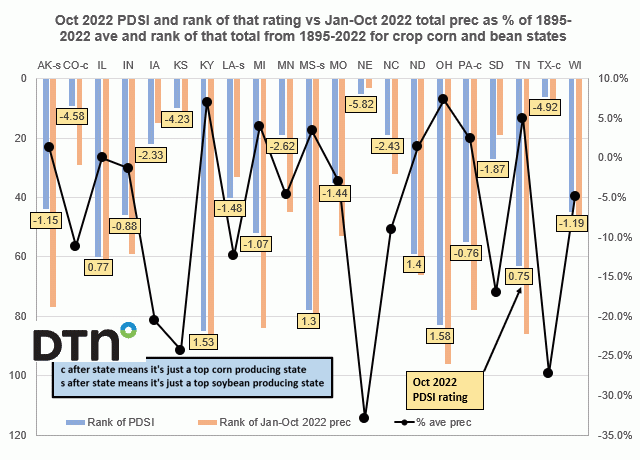
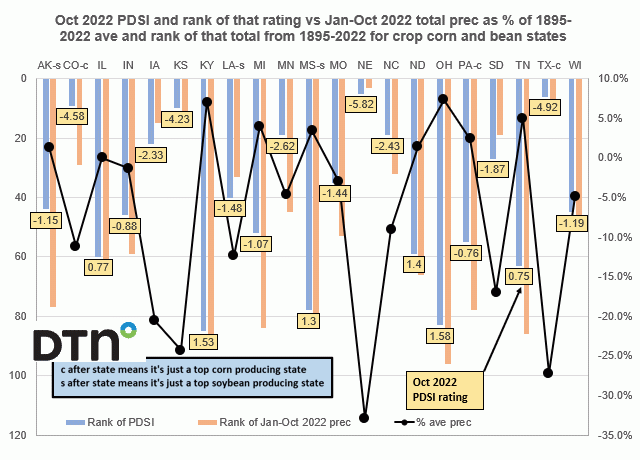
This is particularly so with regard to precipitation as seen in this graphic that shows the October Palmer Drought Severity Index (PDSI) in the yellow rectangles and the rank of that Oct 2022 PDSI from 1895-2022 with 1 meaning the lowest PDSI (very dry) rating and 128 the highest PDSI rating (very wet) on the left-hand axis.
Recall that the PDSI generally ranges from -6 to +6, with negative values denoting dry spells and positive values indicating wet spells.
PDSI values 0 to -0.5 = normal; -0.5 to -1.0 = incipient drought; -1.0 to -2.0 = mild drought; -2.0 to -3.0 = moderate drought; -3.0 to -4.0 = severe drought; and greater than -4.0 = extreme drought while similar adjectives are attached to positive values of wet spells.
Also reported is the total January October 2022 precipitation for each of the top states as a percent of the Jan-Oct 1895-2022 average on the right-hand axis and the rank of that total is also posted on the left-hand axis with 1 meaning the lowest total Jan-Oct precipitation since 1895 and 128 the highest precipitation total.
When looking at the corn and soybean yield maps in terms of bushels and percent change from last year for both crops, NE, KS and TX just got hammered and no it's surprise as NE had a -5.82 PDSI rating as the end of last month extreme drought ranking was the fifth worst since 1895 with their combined Jan-Oct precipitation about 33% below the 1895-2022 average and is the third lowest total since 1895.
Other Plains states in the same boat were CO having a PDSI rating of -4.58 (ninth worst), KS has a -4.23 PDSI rating (tenth worst) with Jan-Oct precipitation 24% below average while TX has a PDSI rating of -4.92 (sixth worst since 1895) having received only 73% of their normal year to date precipitation.
There are a number of Midwest states that are in a moderate drought such as IA and MN, but they have time to see soil moisture supplies replenished whereas the CO, KS, NE, and TX the situation is quite critical right now given the fact that all four produce a lot of hard red winter wheat where the drought and limited moisture so far this year has this year's winter wheat crop in the worst shape ever as it heads off into winter dormancy.
(c) Copyright 2022 DTN, LLC. All rights reserved.


Comments
To comment, please Log In or Join our Community .