Fundamentally Speaking
Price Correlations of Key Commodities, U.S. Dollar
Surprising we haven't seen more commentary on this subject, but the U.S. dollar has been on a tear this month, up 6.4% since the beginning of April and closer to 10% higher since the second week of the year.
In the process we have now taken out the prior peak of around 103.00 seen on March 16, 2020, just when the world was shutting down due to the fast-spreading pandemic.
The current high, around 103.82, was seen right at the start of 2017 just ahead of Trump's inauguration and we would now have to go back to the fall of 2002 to see the last time the greenback was this high.
It is big news that today the U.S. currency is seeing its highest value in the foreign exchange markets in 20 years as this seemed unlikely at the start of the year, especially with the twin budget and merchandise trade deficits resulting in the printing of money which has contributed to the highest rates of inflation in over 40 years.
P[L1] D[0x0] M[300x250] OOP[F] ADUNIT[] T[]
The fact that U.S. interest rates are rising sharply along with the U.S. economy expanding faster than those of our competitors, upward pressure was placed on greenback and that is ostensibly negative to upward commodity price action and makes our goods more expensive in overseas markets, adding to some export pressures being seen along with natural shift this time of year towards cheaper South American supplies.
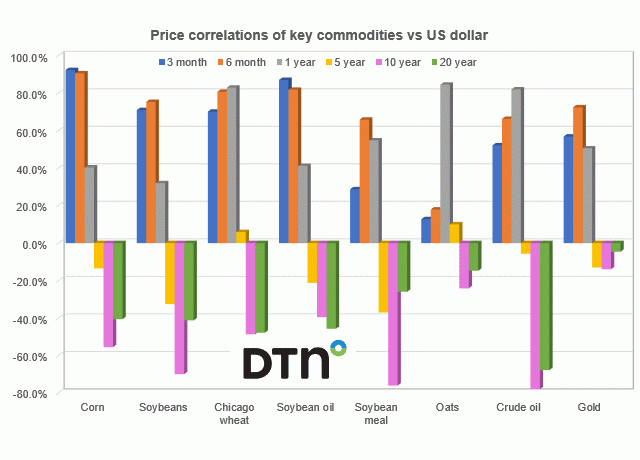
Yet a look at how commodity prices react to the foreign exchange movements of the U.S. dollar show more inverse correlations as one would expect over longer timeframes with tbe dollar actually showing positive correlations over shorter time horizons.
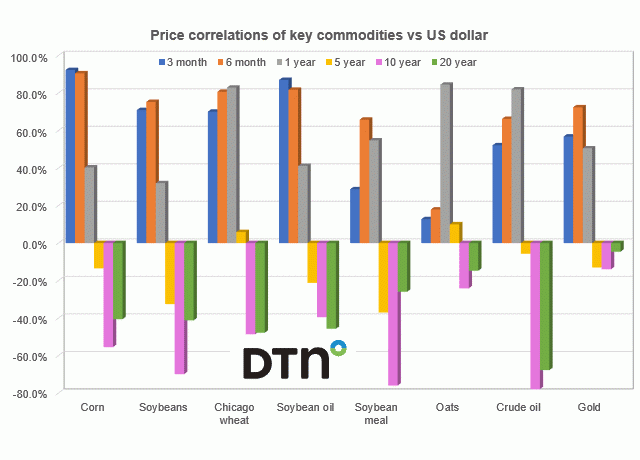
This chart shows the price correlations of key commodities including corn, soybeans, Chicago wheat, oats, soybean oil, soybean meal along with gold and crude oil vs US dollar over time spans of three months, six months, one year, five years, 10 years, and 20 years.
All markets show positive correlations with the dollar over the 3-month, 6-month and 1-year timespans and even oats and Chicago wheat have slight positive correlations with the dollar even extending out to five years.
Most however have negative correlations with the greenback over the 5-year period and all have negative correlations over the 10-year and 20-year periods.
One can say that the fact that the dollar did decline in value from March 2020 to the spring of 2021 by about 13% when the values of most commodities were rising, and even with the appreciation of the dollar since May of 2021, grain and oilseed prices along with gold and crude oil have also pushed higher as the comparative strength of the U.S. economy, which has boosted the dollar's value in the foreign exchange markets, has also buoyed the fortunes of a number of commodities.
Given market expectations for far more aggressive tightening from the U.S. Federal Reserve than seen from other central banks, it appears that the dollar is destined to move even higher.
Eventually that should have a dampening impact on the upward commodity price appreciation especially if the higher interest rates start to subdue economic activity and demand for these goods.
(c) Copyright 2022 DTN, LLC. All rights reserved.


Comments
To comment, please Log In or Join our Community .